discontinued This product has been discontinued and is no longer available. You can still access this page for informational service purposes.

DIVA

DIVA
DIVA
DIVA
DIVA

Data Interpretation Visualization Analysis Creativity in Post-Processing

DIVA  was developed by HORIBA Europe Automation Division for interactive report creation. In contrast to many other evaluation systems, DIVA has a component-based structure which facilitates the operation considerably and gives the complete system a concise design.

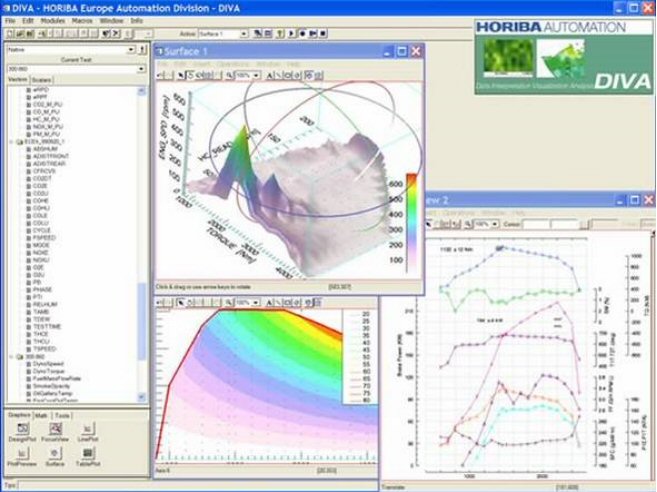
DIVA is made up of a main program including various tools for data import, data representation and macro recording. The data evaluation is performed in embedded components which are divided into various categories.


DIVA's main categories are: Graphics, Math, Tools

Graphics

  • Plot Preview for a quick view of the signal.
  • Line Plot for two-dimensional plot diagrams (x/y axes) and a quick access to the measured values.
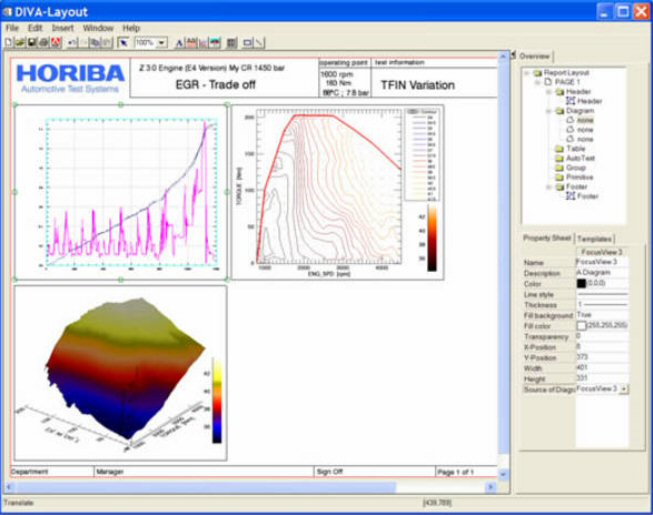
  • Design Plot for complex graphical report formats. In addition to the flexible presentation of signals, text elements and customer logos can be added.
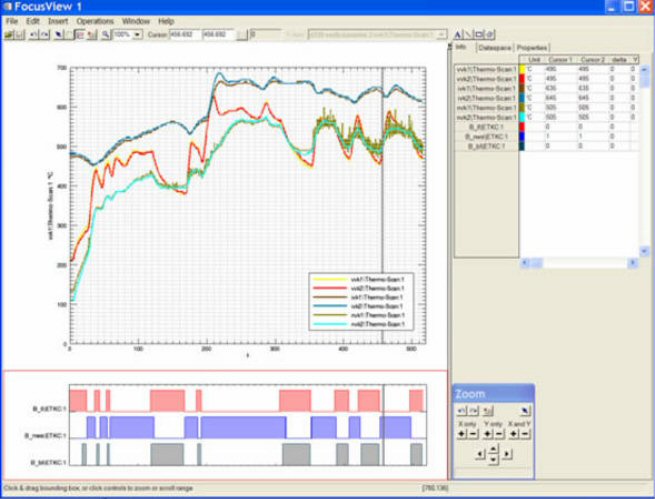
  • Focus View for an extended analysis of the measured data. Templates can be created for standardized plot diagrams.
  • Table Plot for the creation of single value comparisons and mathematical operations in a table-based application.
  • Surface (optional) for the creation of three-dimensional plots.
     

Math

  • Access to use filters for signals (both analog and digital), integrate the original signal and save it as a new signal.
  • Calculator for simple calculations with signals. The calculated signals can be saved as new signals for a test.
  • Mathematic for creation of formulas or use of pre-defined formulas. 
  • Statistic for automatic calculation of statistic values, for example, maximums, minimums, averages etc.
  • Outlier (optional) for testing the values to be correlated for possible outliers.
     

Tools

  • Build for the creation of signals from several single values. You load, for example, 10 tests and combine the NOX ambient bag values of each test to one new signal. This new signal represents the progression of the NOX ambient conditions over a given period of time.
  • Layouter for printing plot diagrams or saving them as image files.
  • Textfield for the export of tests to ASCII text files. 
  • Autoalign (optional) for the adjustment of time shifts of several tests or data loggers.
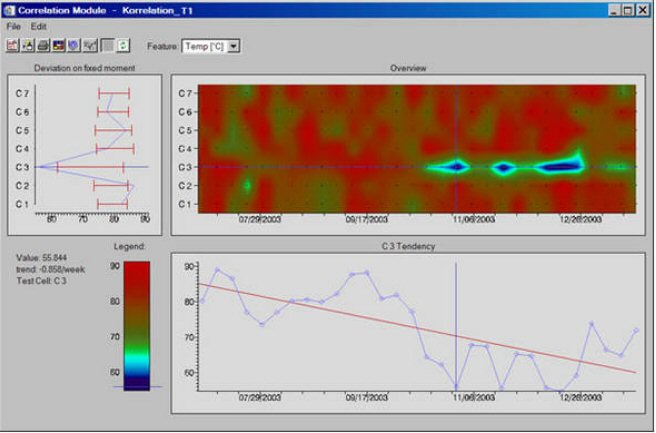
  • Correlation (optional) for the comparison of variables across several tests.
  • DIAS (optional) (DIVA's Automatic Sequence Creation) for the creation of pre-defined diagrams from loaded tests.
     

Macro Functions

Using the macro function, you can record a sequence of steps that you can use for the creation of standard evaluation plots of other tests as well. To execute such an evaluation sequence, you simply start the macro with another test.


Request for Information

Do you have any questions or requests? Use this form to contact our specialists.

* These fields are mandatory.

Corporate