Duetta: 2-in-1 Fluorescence & Absorbance Spectrometer

Duetta Fluorescence and Absorbance spectrometer
Duetta Fluorescence and Absorbance Spectrometer Promo Video
Not Your Standard Spectrometer, Duetta 4 Awards Video
EzSpec Fluorescence and Absorbance Software Video
Duetta Fluorescence and Absorbance Spectrometer Intro Video

Full Spectra in Milliseconds for Industry and Academia

Duetta™ goes beyond fluorescence alone, enabling faster, more complete molecular characterization with a single instrument. Duetta is a unique, high‑speed spectrofluorometer that simultaneously measures fluorescence and absorbance—delivering true molecular fingerprints in seconds.

Duetta replaces that legacy approach with CCD‑based full‑spectrum acquisition, capturing fluorescence and absorbance together across the UV‑Vis‑NIR range and automatically correcting for Inner Filter Effects (IFE) in real time.

Duetta solves key challenges for academic and industrial labs.

Optimized for Research & Teaching LabsSolves Throughput Obstacles for Industrial Applications
Measure low-concentration samples with confidenceCollect data in seconds
Generate publishable, high-quality dataComplete molecular characterization
Teach spectroscopy concepts efficiently to multiple studentsWorks with complex workflows to increase throughput
Avoid instrument bottlenecks during lab sessionsMultiple instruments in one compact package


   Science in Action Series   Spectroscopy Matters Series

Segment: Scientific
Produktionsfirma: HORIBA Instruments Incorporated

Key Features and Performance Benefits

  • 2-in-1 Simultaneous Fluorescence and Absorbance Spectrometer
  • UV-Vis-NIR Fluorescence Detection Wavelength Range from 250 to 1,100 nm
  • Millisecond CCD Detection of Entire Fluorescence Spectrum
  • Full 3-D Fluorescence EEM Acquisition in Less Than One Second
  • Best in Class Fluorescence Sensitivity Specification of 6,000:1 RMS for Water Raman
  • Automatic Correction for Primary and Secondary Inner Filter Effects (IFE)
  • High Fidelity Molecular Fingerprinting with Unique A-TEEM™ (Absorbance-Transmittance Excitation Emission Matrix) Technology


Applications Powered by Duetta


“We endeavored to take as much advantage as possible of the wide excitation and emission capability of the HORIBA instrument (excitation/ emission matrix, EEM) so that emission at unexpected wavelengths was not missed.”
- S. Sma-Air et al, Spectrofluorometric insights into the application of PAM fluorometry in photosynthetic research

  • Algal and Chlorophyll Analysis


"EEM spectroscopy can be implemented as a powerful technique for determining the purity of complex mixtures, especially when other techniques, including mass spectrometry, fail to provide adequate characterization of a given material."... "The determination of different cluster species was only made possible with the complete fluorescence profiles provided from EEM spectroscopy."
- K. Stamplecoskie et al. "The power of fluorescence excitation–emission matrix (EEM) spectroscopy in the identification and characterization of complex mixtures of fluorescent silver clusters"

"The inherent value of EEMS is not just for characterizing a single emission species!”
- H. Ramsay et al. "The power of fluorescence excitation-emission matrix (EEM) spectroscopy in the identification and characterization of complex mixtures fluorescent silver clusters.”

"EEM provided a thorough evaluation of the correlations between the excitation and emission spectra."
- S. Takahama et al, “Variation in the responses of carbon quantum dots (CQDs) synthesized from native coconut husk and coconut husk-derived charcoal.”

“Using EEM spectroscopy, it is possible to visualize the complete fluorescence profile of each of the three cluster species isolated from RP-HPLC."
- H. Ramsey et al, "The power of fluorescence excitation-emission matrix (EEM) spectroscopy in the identification and characterization of complex mixtures fluorescent silver clusters."


"The Duetta can measure absorbance and fluorescence simultaneously allowing easy inner filter correction. All spectra were corrected for both Rayleigh scattering and inner filter effects."
- AW Harrison et al, “Reaction of Glyoxal and Ammonium as a Potential Contributor to Protein-like Fluorescence in Atmospheric Measurements.”


"EEM was an efficient method for determining the optical properties of CQDs in detail." 
-    S. Takahama et al, “Variation in the responses of carbon quantum dots (CQDs) synthesized from native coconut husk and coconut husk-derived charcoal.”


Why Scientists Choose Duetta 

  • Speed & Sensitivity: Capture full spectra in milliseconds, enabling kinetic studies and high-throughput screening. 
  • Broad Spectral Range: Analyze samples from UV to NIR, including challenging nanomaterials and biological tissues. 
  • Advanced Data Analysis: Integrated multivariate tools and A-TEEM™ technology for robust molecular fingerprinting and correction of inner-filter effects. 
  • Versatility: Seamlessly switch between absorbance and fluorescence modes for comprehensive sample characterization.


Featured Video
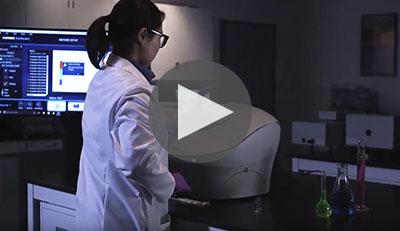
A Superior Spectrometer Concept

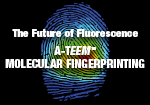
The Future of Fluorescence

  • Three-in-one Fluorescence and Absorbance Spectrometer
  • UV-Vis-NIR Fluorescence Detection Wavelength Range from 250 to 1,100 nm
  • Full 3-D Fluorescence EEM Acquisition in Less Than One Second
  • Best in Class Fluorescence Sensitivity Specification of 6,000:1 RMS for Water Raman
  • Automatic Correction for Primary and Secondary Inner Filter Effects (IFE)
  • High Fidelity Molecular Fingerprinting with Unique A-TEEM™ (Absorbance-Transmittance Excitation Emission Matrix) Technology
  • Millisecond CCD Detection of Entire Fluorescence Spectrum

Fluorescence and Absorbance in one Spectrometer!

Duetta can be used as a fluorometer, as a UV-Vis-NIR spectrometer to measure absorbance, or as an instrument that measures true molecular fingerprints, which require the acquisition of fluorescence and absorbance, correcting for IFE in real time.

Fluorescence in the Blink of an Eye!

Duetta’s ultra-fast, state-of-the-art CCD technology allows it to outperform, by orders of magnitude, any competitor using PMTs. It’s the fastest bench-top fluorometer in the world, and the only fluorometer that can acquire a full spectrum in less than 100 milliseconds! This state-of-the-art CCD technology also extends NIR wavelength detection to 1,100 nm, well beyond the limit of a standard PMT fluorometer.

Highest Fluorescence Sensitivity in its Class

Having the highest level of fluorescence sensitivity means that Duetta’s optimized design lets you measure lower concentrations of a sample, and provides better quality data.

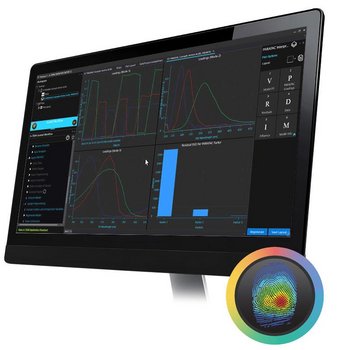
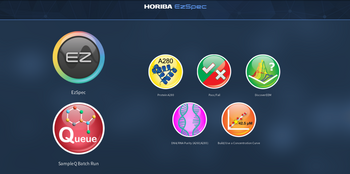
EzSpec™ Touch-Screen Software!

Duetta debuts HORIBA’s new generation software interface with touch-screen utility, and a selection of Apps for routine analysis.
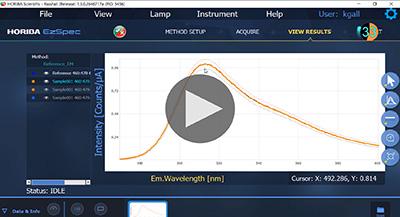
Watch how EzSpec software performs the Pass/Fail

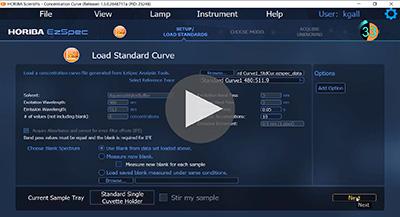
EzSpec Software obtains a concentration curve

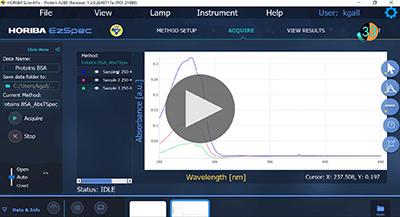
EzSpec Software executes a Protein A280 concentration

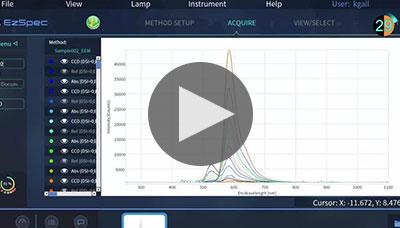
EzSpec Software discovers Fluorescence profiles in about 60s


 DuettaDuetta-Bio
Acquisition ModesAbsorbance and Fluorescence Spectrometer
Fluorescence SensitivityWater Raman SNR >6,000:1 RMS, 350 nm excitation, 5 nm slits
Spectral Acquisition Rate510,000 nm/min
EEM Acquisition RateAs fast as 1 second (sample and wavelength dependent)
A-TEEM Acquisition RateAs fast as 30 seconds (sample and wavelength dependent)
Fluorescence DetectorCCD/Spectrograph
Fluorescence Detector Range250 to 1,100 nm
Fluorescence Bandwidth1, 2, 3, 5,10, 20 nm (excitation and emission)
Light Source75 W Xenon arc lamp. Dedicated cartidge for snap-in replacement
Excitation/Absorbance Wavelength Range250 to 1,000 nm
Absorbance DetectorSilicon Photodiode
Absorbance Detector Range250 to 1,000 nm
Absorbance Bandwidth1, 2, 3, 5,10, 20 nm
Absorbance Range0 to 2 A
Absorbance Accuracy+/- 0.02 A
Wavelength Accuracy+/- 1 nm
Computer RequirementsWindows 10 or 11 64-bit OS, laptop or PC with at least 1 USB port (more for additional accessories)
SoftwareEzSpec™
Dimensions (W x D x H)17 x 20.4 x 14.4 inches; 43.18 x 51.816 x 36.576 cm
Weight45 pounds; 20.4 kg
Polarizers (Time of Purchase)Not AvailableYes (280 to 750 nm)
Rapid Quality Assessment of Essential Oils using Fluorescence Excitation-Emission Matrix Spectroscopy
The Duetta was used to collect Excitation-Emission Matrices that distinguish different species of essential oils, as well as the same species by region of origin. A 50/50 mixture of lavender and eucalyptus demonstrated the ability of the approach to qualitatively identify an adulterant.
Using Duetta to Detect Saffron Adulteration
Saffron is a target for adulteration due to its high price. Other compounds can be added, such as minerals, oils or synthetic colorants. The two in one Duetta spectrometer was used to rapidly acquire Excitation Emission spectra for different saffron samples from different suppliers.
The Power of Duetta and EzSpec Software for Biological Applications
Duetta is an analytical instrument capable of recording both the fluorescence and the absorbance of a sample. Absorbance data provides concentration-dependant information on non-fluorescent compounds. Through its user-friendly software, Duetta allows different measurements related to biomolecules like DNA, RNA and proteins including protein concentration, DNA/RNA purity, finding the concentration of an unknown sample based on a standard-based calibration curve, Pass/Fail testing and all standard fluorescence and absorbance related measurements. All these functionalities are possible through dedicated applications in EzSpec™ software for Duetta.
Protein Quantification at Low Concentration using Fluorescence and Absorbance
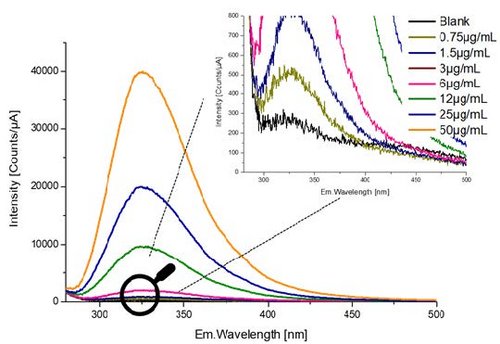
In this application note, we highlight the high sensitivity of the Duetta for measuring transferrin at very low concentrations. The Duetta spectrofluorometer combines both fluorescence and absorbance measurements simultaneously, thus providing key advantages for protein analysis. In parallel, we compare the fluorescence results obtained using the Duetta with absorbance results obtained with a dedicated low-volume, benchtop spectrophotometer.
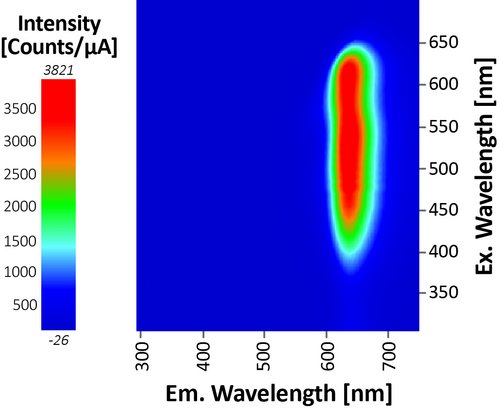
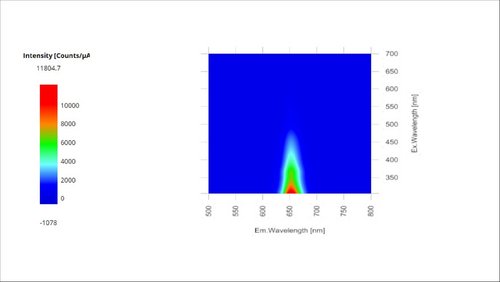
How Inner-Filter Effects (IFE) can affect your fluorescence measurements: A case study - Colloidal InP Quantum Dots
During the last two decades, a great deal of attention has been focused on the optoelectronic properties of nanostructured semiconductors or Quantum Dots (QDs).
Quantum Dot Absorbance, Photoluminescence Spectra and Lifetimes
Quantum dots (QDs) are semiconducting spheres in the size typically in the range of 1 to 10nm. The size of these small spheres give quantum dots the semiconducting properties and resulting photoluminescence that would not necessarily occur for the same material on larger scales.
Protein A280 for Protein Concentration
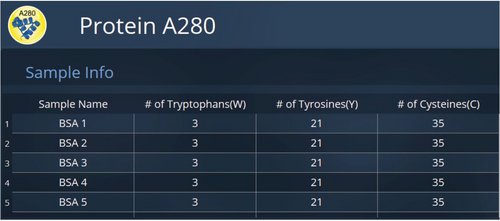
The new HORIBA Duetta fluorescence and absorbance spectrometer offers many unique benefits for molecular spectroscopy. It is primarily thought of as a spectrofluorometer that combines absorbance and fluorescence spectroscopy to correct the fluorescence fingerprint for concentration-related effects. Duetta can also be used as a precise absorbance spectrometer. This application note explores the use of Duetta for a common absorbance application, the Protein A280 application.
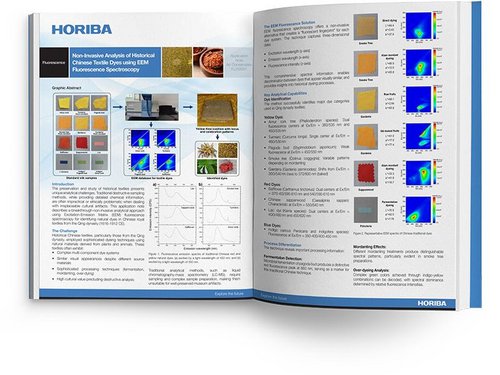
Non-Invasive Analysis of Historical Chinese Textile Dyes using EEM Fluorescence Spectroscopy
This application note describes a breakthrough non-invasive analytical approach using Excitation-Emission Matrix (EEM) fluorescence spectroscopy for identifying natural dyes in Chinese royal textiles from the Qing dynasty (1616-1912 CE).

Informationsanfrage

Sie haben Fragen oder Wünsche? Nutzen Sie dieses Formular, um mit unseren Spezialisten in Kontakt zu treten.

* Diese Felder sind Pflichtfelder.

Zubehör

A-TEEM Direktor
A-TEEM Direktor

Your Guide to Multivariate Analysis

Verwandte Produkte

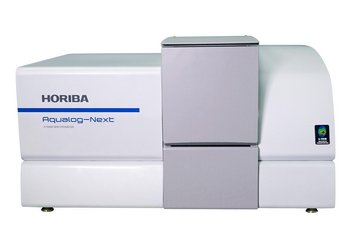
Aqualog®-Next: The Future of Water Analysis is Here

Unlock Unprecedented Insights into Water Quality and Environmental Health

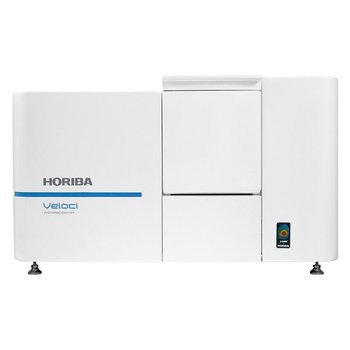
Veloci BioPharma Analyzer

A-TEEM Spectroscopy

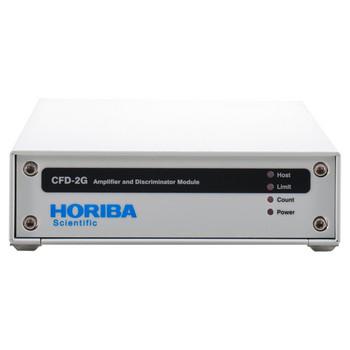
CFD-2G
CFD-2G

Amplifier-Discriminator

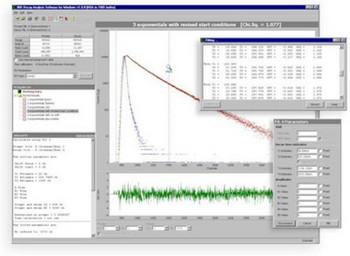
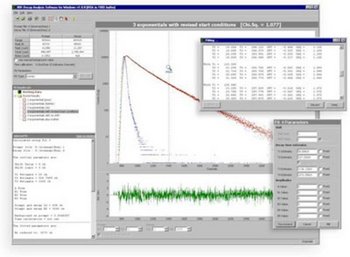
DAS6
DAS6

Decay Analysis Software

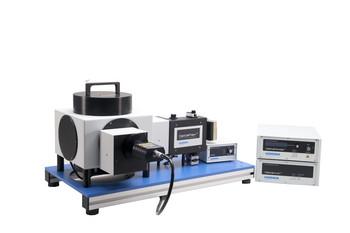
DeltaFlex
DeltaFlex

TCSPC/MCS Fluorescence Lifetime System

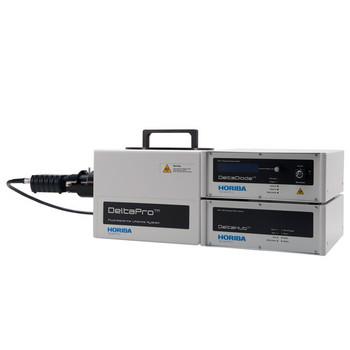
DeltaPro
DeltaPro

TCSPC Lifetime Fluorometer

Fluorolog-QM
Fluorolog-QM

Modular Research Fluorometer for Lifetime and Steady State Measurements

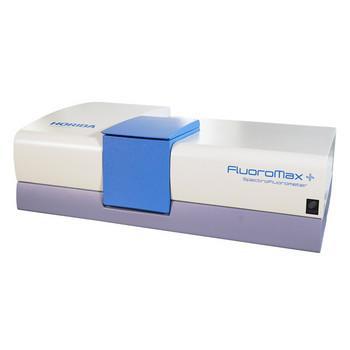
FluoroMax Plus
FluoroMax Plus

Steady State and Lifetime Benchtop Spectrofluorometer

Hybrid Picosecond Photon Detector (HPPD) Series

HORIBA’s latest development in TCSPC detector technology

Nanosizer
Nanosizer

For Single‐Walled Carbon Nanotube Excitation‐Emission Map Simulation and Analysis

PPD Photon Counting Detector

Single photons detection with picosecond accuracy

SpectraLED
SpectraLED

LED Phosphorescence Light Sources

Aqualog Datastream
Aqualog Datastream

For Instant Water Quality Reports

Aqualog®-Next: The Future of Water Analysis is Here

Unlock Unprecedented Insights into Water Quality and Environmental Health

CFD-2G
CFD-2G

Amplifier-Discriminator

DAS6
DAS6

Decay Analysis Software

DeltaDiode
DeltaDiode

TCSPC Pulsed Sources

DeltaFlex
DeltaFlex

TCSPC/MCS Fluorescence Lifetime System

DeltaPro
DeltaPro

TCSPC Lifetime Fluorometer

FLIMera
FLIMera

SPAD array imaging camera for dynamic FLIM studies at real time video rates

Fluorolog-QM
Fluorolog-QM

Modular Research Fluorometer for Lifetime and Steady State Measurements

FluoroMax Plus
FluoroMax Plus

Steady State and Lifetime Benchtop Spectrofluorometer

Hybrid Picosecond Photon Detector (HPPD) Series

HORIBA’s latest development in TCSPC detector technology

LabRAM Odyssey
LabRAM Odyssey

Confocal Raman & High-Resolution Spectrometer

LabRAM Odyssey Semiconductor

Photoluminescence and Raman Wafer Imaging

LabRAM Soleil
LabRAM Soleil

Raman Microscope

Modular Raman Microscope

Bench-top macroscopic Raman spectrometer

Nanolog
Nanolog

Steady State and Lifetime Nanotechnology EEM Spectrofluorometer

Nanosizer
Nanosizer

For Single‐Walled Carbon Nanotube Excitation‐Emission Map Simulation and Analysis

PPD Photon Counting Detector

Single photons detection with picosecond accuracy

QuantaPhi-2
QuantaPhi-2

PLQY Integrating Sphere

SpectraLED
SpectraLED

LED Phosphorescence Light Sources

Universal Fiber Coupling Solution

Connect any of our steady state and hybrid fluorometers to virtually any upright or inverted microscope!

XploRA™ PLUS
XploRA™ PLUS

MicroRaman Spectrometer - Confocal Raman Microscope

Corporate