Haute résolution spatiale et spectrale
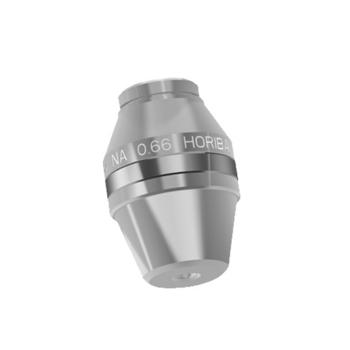
La conception optimisée du spectromètre à simple étage à haute sensibilité de 800 mm de focale d'HORIBA Scientific permet de développer les instruments les plus sensibles du marché, avec une résolution spatiale optimale et une diffraction limitée. Sur le plan spectral, le spectromètre haute résolution facilite la caractérisation d'informations subtiles d'un échantillon, telles que la cristallinité, le polymorphisme, la contrainte et d'autres analyses de bandes.
De l'UV profond au proche Infrarouge sans concessions
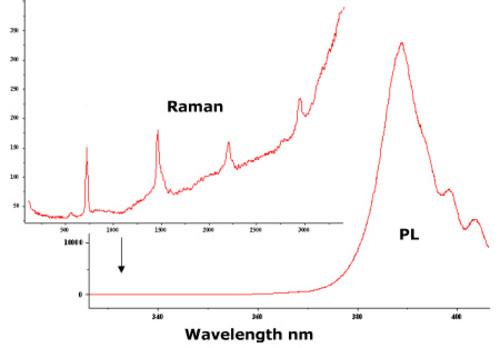
La compatibilité avec une large gamme de longueurs d'onde laser et la possibilité de monter jusqu'à trois détecteurs permettent d'étendre la gamme de longueurs d'onde de mesure de 200 nm à 2200 nm. La configuration UV optimisée offre une solution idéale pour l'analyse Raman UV avec des longueurs d'onde inférieures à 400 nm. Ces performances ouvrent la voie à d'autres techniques spectroscopiques telles que la spectroscopie Raman UV, la spectroscopie Raman de résonance et la photoluminescence, pour une caractérisation détaillée d'échantillons de matériaux très variés.
Facilité d'utilisation et ergonomie
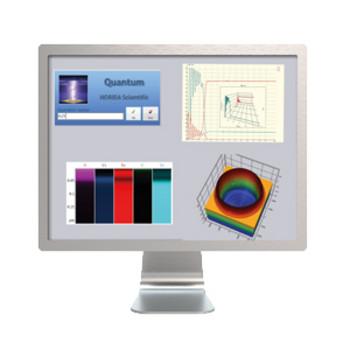
La conception intelligente et entièrement automatisée du LabRAM Odyssey garantit des performances ultimes associées à une grande facilité d'utilisation. Le vaste choix d'applications dédiées à LabSpec 6, disponibles dans le LabStore, permet de configurer et de faire évoluer le logiciel en fonction de vos besoins.
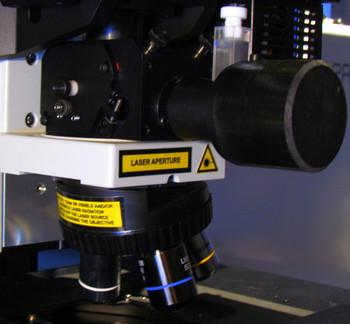
Le LabRAM Odyssey offre un haut niveau d'automatisation, tel que le choix du laser, une tourelle à objectifs automatisée, ou encore la calibration spatiale automatique avec sa fonction VRM brevetée.
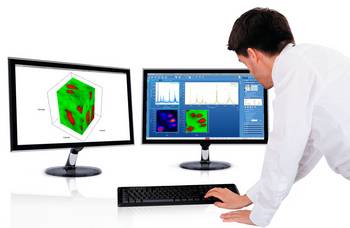
Imagerie confocale ultrarapide
Le LabRAM Odyssey intègre les technologies uniques d'imagerie Raman rapide SWIFT™ et DuoScan™.
DuoScan™ est un mode d'imagerie confocale, avec des miroirs de balayage haute précision ultrarapides qui créent des macro-points laser de taille variable et permettent de réaliser une cartographie par macro-pas, de l'UV profond au proche IR.
SWIFT™ assure une cartographie Raman confocale avec des temps d'intégration CCD pouvant descendre à 1 ms par point, voire moins.
La combinaison unique d'optiques, de détecteurs et de logiciels innovants permet d'obtenir une véritable imagerie confocale Raman avec une vitesse d'acquisition des données inégalée.
Compatible Raman-AFM et TERS
Grâce à sa grande flexibilité, le LabRAM Odyssey est la plateforme idéale pour combiner l'analyse Raman-AFM et la recherche par spectroscopie nano-Raman TERS (diffusion Raman exaltée par effet de pointe).
Le LabRAM Odyssey peut également intégrer notre fonction brevetée nanoGPS™ navYX pour réaliser une caractérisation collaborative complète avec diverses autres modalités de microscopie telles que SEM, FTIR, et autres.
Module à ultra-basse fréquence (ULF)
Le LabRAM Odyssey allie simplicité d'accès aux très basses fréquences, jusqu'à 5 cm-1, avec un spectromètre haut rendement à plateau unique, grâce au module ULF. La nouvelle génération de filtres coupe-bande et passe-bande améliore la caractérisation de l'échantillon dans une région spectrale rarement accessible avec d'autres spectromètres de base.
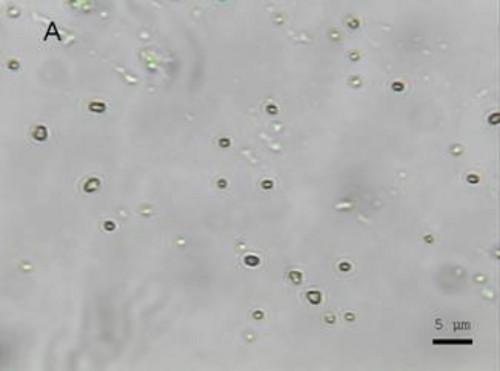
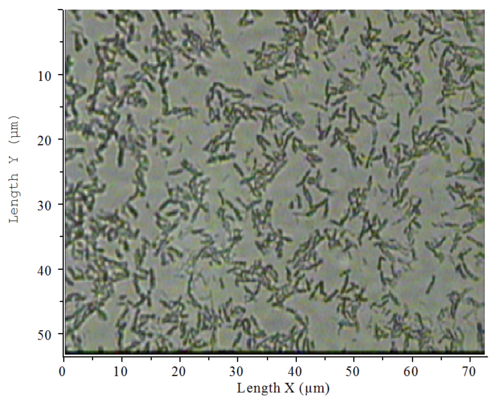
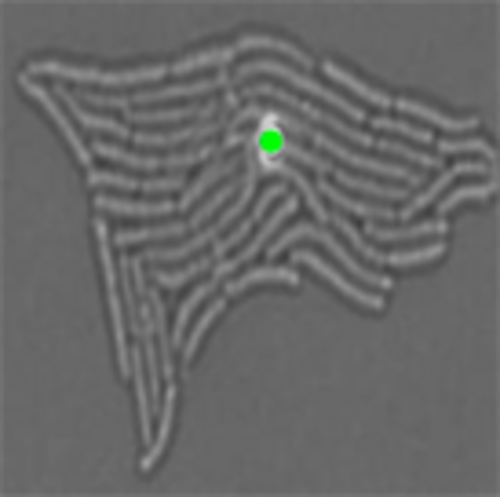
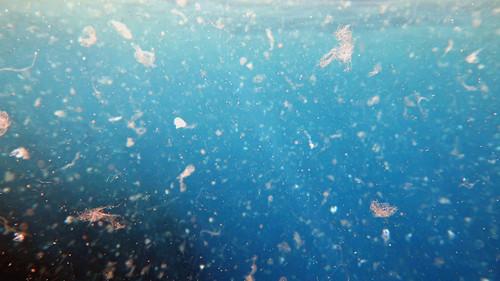
Localisation et identification chimique automatisée des particules
ParticleFinder est un outil convivial de localisation, de caractérisation et d'analyse Raman automatisées des particules. Les fonctions Raman avancées du LabRAM Odyssey permettent de localiser et de caractériser rapidement des centaines, voire des milliers de particules.
Profitez des meilleures conditions pour l'analyse de votre échantillon
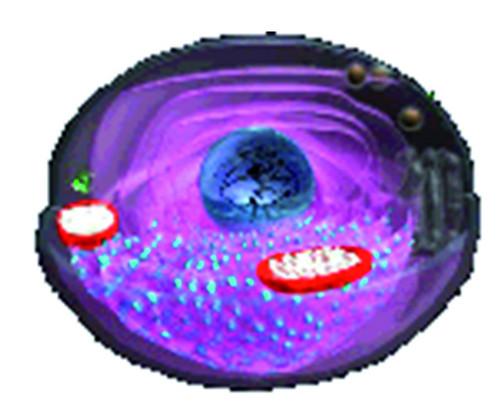
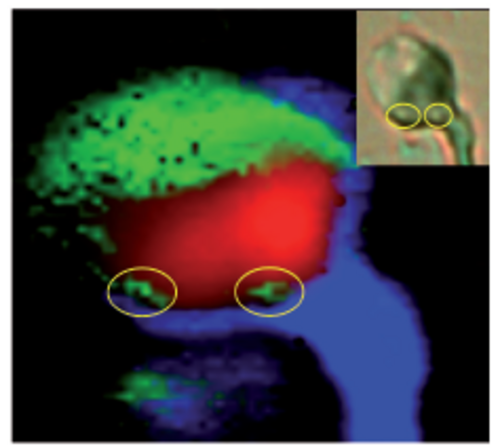
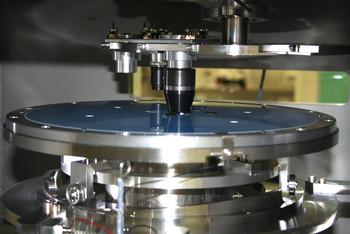
La flexibilité d'échantillonnage du LabRAM Odyssey permet d'optimiser pleinement vos recherches. Il est équipé de série d'un microscope en espace ouvert. Le dégagement sous l'objectif vous permet ainsi d'adapter de nombreux accessoires, comme des cryostats de grande dimension ou des plateaux à large débattement. Dans le domaine de la recherche en sciences de la vie, le microscope inversé offre un échantillonnage idéal pour les cellules et les tissus.
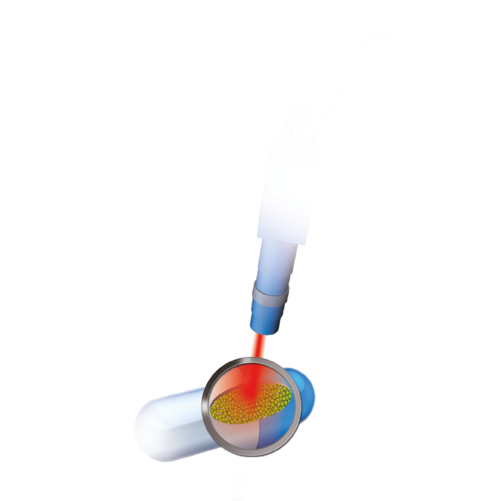
Piégeage laser CaptuR
Cette solution unique de piégeage laser intégrée est idéale pour le contrôle des particules fines lors des analyses microscopiques.


.")

 UFS-RF-GDOES depth profile of the PMSPC; (b) zoom on the first 80 s of the analysis.")


")
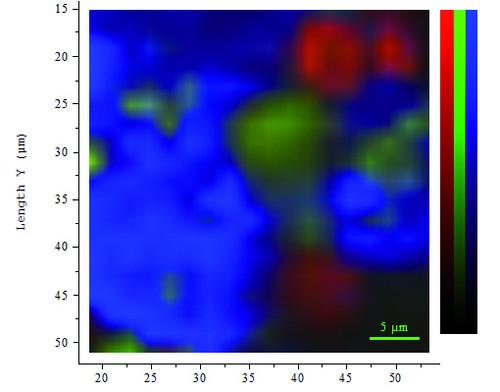
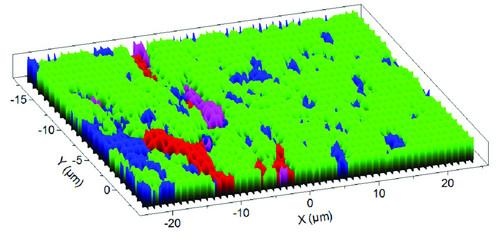
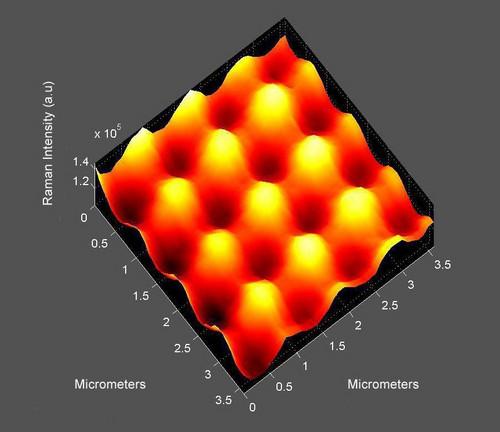
 Raman map of MoS2 layers.")