
Single wall carbon nanotubes (SWCNT’s) have unique mechanical and electronic properties and therefore have attracted much interest. These nanotubes consist of rolled up single sheets of carbon atoms and due to the high aspect ratio and nature of the C-C bonds have unique properties. Figure 1 shows the structure of a SWCNT. SWCNT’s have been characterized by a number of techniques including fluorescence spectroscopy (1-3) and Raman scattering (4). A number of techniques are necessary to obtain a complete picture of these complex materials.
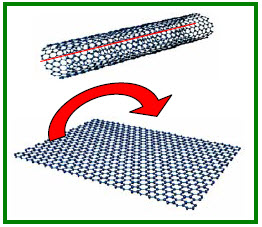
Figure 1: Illustration of a single wall carbon nanotube from a rolled up sheet of carbon
Dynamic light scattering (DLS) has become the technique of choice for characterizing nanomaterials in suspension due to its speed and ability to readily characterize a statistically significant number of particles. The technique measures the fluctuations in the intensity of scattered light that arise due to particle motion. This is then converted to particle diffusion coeffient and finally to particle size.
A dispersion of Southwest Nanotechnologies SG65 nanotubes in aqueous sodium cholate was vigorously shaken to break up loose aggregates. It was then measured with the SZ-100, shown in Figure 2, by right angle scattering (90°) for six repeats of two minutes each. The effect of dust (large particle impurities) was suppressed by the noise cut feature of the software. Data was analyzed by the technique of cumulants.
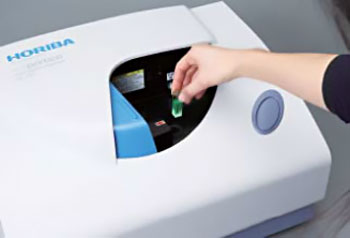
Figure 2: SZ-100 Nanoparticle Analyzer
The obtained Z-average size values are shown in Table 1 below. Figure 3 shows a representative size distribution obtained with the SZ-100. Note the excellent repeatability of the Z-average size results. Here, the standard deviation of 4.8 corresponds to a coefficient of variation of 4.4%.
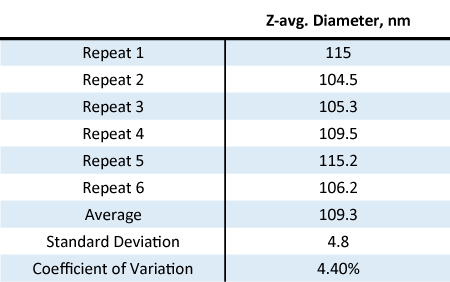
Table 1: DLS measurement of carbon nanotubes with the SZ-100
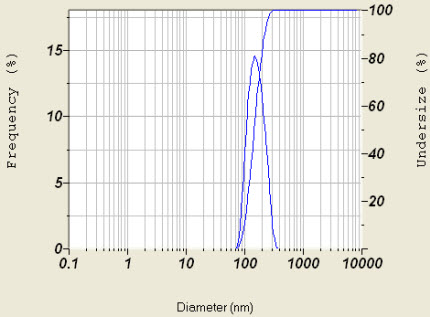
Figure 3: Intensity based distribution of carbon nanotube sizes obtained with the SZ-100
Dynamic light scattering data is typically interpreted in terms of a sphere. That is, the results correspond to the diameter of a sphere that moves in the same way as the analyte particle. However, as the name suggests, nanotubes are long cylinders. For example, the nanotube under study has an aspect ratio close to 1000. Thus, the results from DLS do not clearly correspond to a single dimension (length or diameter) of the tube, but rather to a combined value. Nevertheless, due to its speed DLS is a good technique for characterizing the size of these nanotubes.
It is possible to estimate the diffusion coefficient of a carbon nanotube. Here is a relation from Nair et al (5):

where:
We can compare this to the Stokes-Einstein relationship used to determine particle size from the translational diffusion coefficient determined by DLS.

where Dh is hydrodynamic diameter. The result is that the value of Dh found by DLS in terms of tube length (L) and tube diameter (d) is given by the following equation.

Using the L and d values for this material (aspect ratio 1000 and diameter of 0.7 to 0.9 nm (6) ), the calculated hydrodynamic diameter is found to be between 97 and 125 nm depending on the chosen value for tube diameter. This range includes the DLS data obtained here. Thus, the measurement results are consistent with expectations.
The SZ-100V2 Nanoparticle Analyzer can be used to characterize the size of carbon nanotubes in dispersion. It is also useful for a number of other nanomaterials.
Nanoparticle Analyzer
Do you have any questions or requests? Use this form to contact our specialists.
