Latest issue of HORIBA Technical News Letter “e-Readout”
Abstract We developed the Partica CENTRIFUGE CN-300, centrifugal nanoparticle analyzer to measure the size distribution of nanoparticles by using the photo-centrifuge method of the sedimentation technique. We validated this apparatus by accurately measuring several kinds of sample distributions such as mono-dispersed, poly-dispersed, or broad distributions. We confirmed high performance for accuracy, resolution and repeatability in the apparatus by the use of certified reference standards. Therefore, Partica CENTRIFUGE can be used as an evaluation tool for nanomaterials being developed and commercialized in the nanomaterial field.
Dr. YAMAGUCHI Tetsuji
Scientific / Semiconductor Product R&D Center
Research & Development Division
HORIBA, Ltd.
► Click Here to original paper (PDF file)
Introduction
Nanotechnology is the use of nanoparticles for the manufacturing of nanostructural materials. Nanotechnology has attracted great interest on a worldwide scale, and many kinds of nanomaterials have been synthesized. Their critical characteristic is that they show different properties from the bulk materials [1]. In the field of powder technology, the synthesized nanoparticles’ size distribution are typically evaluated by the use of dynamic light scattering (DLS) [2]. However, this method has difficulties in distinguishing small nanoparticles from large particles because the scattered light intensity from small nanoparticles is weak compared to the scattered light from large particles. Therefore, this apparatus can measure only large particles in a multi-modal particle mixture. On the other hand, the photo centrifugal liquid sedimentation method (PCLS) [3] can measure particle size distribution of a multi-modal sample with high resolution. Because the sedimentation velocity of each particle is dependent upon the mass of that particle, the heavy particles with larger diameters sediment faster and the light particles with smaller diameters sediment slower. Therefore, the problem of the DLS, does not exist for the PCLS, because, in this method the particles are classified first by their sizes. In this principle, the particle diameter is calculated by measuring the sedimentation velocity, and each particle’s concentration is equal to the absorbance calculated from transmitted light by the use of Beer’s Law.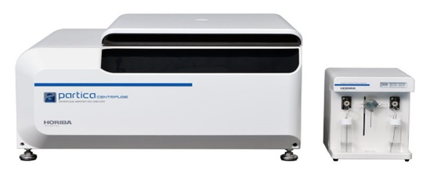
Figure 1 (a) Partica CENTRIFUGE CN-300 (left), (b) Density Gradient Fractionator CY-301 (right)
The measured concentration is determined in the area-based size distribution, and the volume-based size distribution can be calculated from this value. We developed the unique PCLS apparatus in Figure 1(a) with cuvette cells in the disc rotor.
Reference materials
Several kinds of silica microsphere standards and polystyrene latex (PSL) microsphere standards were used to verify the PCLS apparatus performance. They are traceable to the National Institute of Standards and Technology (NIST). The silica microsphere standards were provided by Thermo Fisher Scientific (TFS) as shown in Table 1. The PSL microsphere standards that were provided by TFS are shown in Table 2. Another standard was a Tri-Modal PSL (TPF-PSL) provided by TFS that mixed three kinds of PSL in equal proportions with the sizes shown in Table 3. For validating the measurement repeatability of the apparatus, broad dispersions of industrial silica slurries were used. They have the particle density of 1980 kg/m3 and the refractive index of 1.45.
Table 1 Information for the silica standards
Table 2 Information for the PSL standards
Table 3 Information for the TPF-PSL standard
Sample preparation
Two types of measurement methods were selected based upon the sample condition; one is a homogeneous method, and the other is the line-start method. The sample preparation is different for the two methods. For the homogeneous method, a colloid sample is diluted with pure water until an absorbance of 1.0 is achieved and it is poured into a cell and measured. For a gradient measurement liquid is poured into a cell for the line-start method. The gradient liquid is made from an aqueous sucrose solution. The sample is fed into the cell via the cell cap. A gradient liquid of 8-24% was used to measure the silica microsphere standards or the silica slurry, and a gradient liquid of 2-6% was used to measure PSL microsphere standards. The density gradient liquid is made by the density gradient fractionator shown in Figure 1(b).
Product overview
The Partica CENTRIFUGE consists of a centrifuge with refrigeration (250 W cooler), a rotor (200 mm diameter), two cuvette cell units (15×16×35 mm), a light emitting diode (LED, 470 nm) as a light source, and a photodiode detector. The rotor has two ports for a reference cuvette cell unit and a sample cell unit. The cell unit consists of a cell, a cell cap, and a cell cup. The cell has a pair of windows through the light path to permit the measurement of the light attenuation. The cell cap functions to prevent solvent leakage and functions for the storage of the sample. The cell cups protect the cells from centrifugal force during rotation. Figure 2 shows a block diagram of the design. The centers of the windows in the cell are the detecting position, and the optical path between the light source and the detector is aligned with the detection position. The measurement method for the two methods uses the same optical system and the same cell units. The rotor is controlled by constant acceleration from 0 to 18,000 rpm maximum and at a constant speed after reaching 18,000 rpm. The centrifugal force at this maximum rotation speed of 18,000 rpm is 30,000 G. When the temperature of rotor increases due to rotational friction, the temperature is controlled so that the liquid temperature in the cell is constant at 30 degrees C. This is performed by the cooling pipe from the refrigerator which is wrapped around the outer chamber. The signal from the detector is amplified and is transferred to the PC after being converted to a digital signal by the ADC.
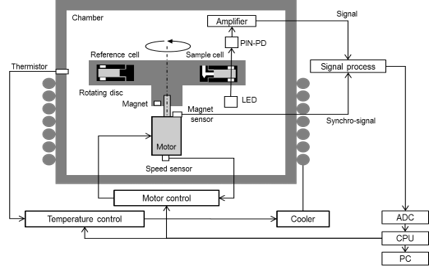
Figure 2 Block diagram
Principle
This apparatus is based on the centrifugal liquid sedimentation method, and the particles are measured by the photo-centrifuge method. This is a measurement method that combines the sedimentation equation of Stoke’s and the Beer’s Law proportional relationship between absorbance and particle concentration. Details are described in ISO 13318-2:2007 [3]. The sedimentation speed V m/s can be provided by the Stokes equation (1):
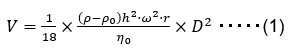
where D m is diameter, ρ kg/m3 is particle density, ρ0 kg/m3 is solvent density, η 0 Pa・s is viscosity, h m is sedimentation distance, r m is distance between the center of rotor and the measurement point, and ω rad/s is the rotational angular velocity. When measuring relatively dilute dispersions, it is recommended to measure these by the homogeneous method to achieve good repeatability. On the other hand, when measuring relatively high concentration dispersion, it is recommended to measure by the line-start method which enables high resolution measurements. In the line-start method, the calibration measurement is carried out before the sample measurement. The cell cap for the line-start method has a sample inlet and injection guide hole.
The measurement sample and calibration sample of 2-50 μL is stored in the inlet during the measurement preparation. At the same time that the rotor begins to rotate, the sample moves to exit of hole in the cap due to the centrifugal force and the liquid forms as the top layer above the density gradient liquid. The rotor rotates counterclockwise, and each cell passes in front of the light path between the LED light source and the detector. The transmitted light intensity when the reference cell passed is Ir (t), the transmitted light intensity when the sample cell passed is (t). The rotation starting time is t = 0, and the final time of the measurement is t = end. x1 m is the distance between the center of rotor and liquid surface, x2 m is the distance between the center of rotor and the detecting point. ω 0 rad/s is an angular velocity at t = 0, ω max rad/s is an angular velocity at 18,000 rpm, and α rad/s2 is an angular acceleration.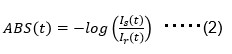
The absorbance curve of the x-axis, (t) and y-axis, (ABS(t)) is obtained from equation (2). The area-based size distribution is obtained by converting the x-axis from t to D(t) by the use of the equation (3). The y-axis of area-based size distribution times D(t) produces the volume-based size distribution.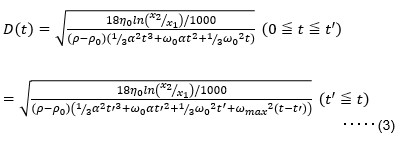
There are some correction coefficients relating to the following issues: KAMAC correction to correct for dilution effects, absorbance correction for smaller size particle, smoothing process, calculation range setting, turbulence correction, particle shape correction, porosity ratio correction, etc. In the line-start method, the average density and average viscosity of the sucrose solution in the range between liquid surface and detecting point are needed. The density, viscosity, and refractive index are input at thirty degrees centigrade.
Experiment
For the validation of PCLS apparatus, the resolution was evaluated using 9 mixtures of mono-dispersed standards. The repeatability was evaluated using silica slurries with broad distributions. One drop each of four kinds of silica standard in Table 1 were mixed in a vial. Then 10 μL sample of this mixture sample was measured by the line-start method. The catalog No.8100 silica sample, 1.0 μm was used for calibration. The average density value was used for the calculation, because the densities of four kinds of silica in Table 1 are different. The measurement diameters are modal diameters, and the certified diameters are the mean diameters. Figure 3 shows the volume-based size distribution with four peaks, and the measurement diameters agree well with the certified diameters in parentheses.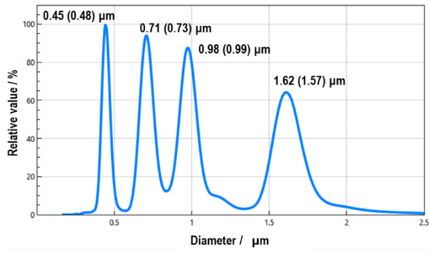
Figure 3 Volume-based size distribution of 4 mixed silica particles in the Table 1. ( ) = certified diameter.
One drop each of five kinds of PSL standards in Table 2 were mixed in a vial. And 10 μL sample of this mixture sample was measured by the line-start method. The catalog No.4011A PSL sample, 1.1 μm was used to calibrate. The measurement diameters were mode diameters, and the certified diameters were the mean diameters. Figure 4 shows the volume-based size distribution with five peaks between 1.1 and 2.0 μm, proving the high resolution, and the accuracy compared to the certified diameters. The difference of measured value is due to the difference between the mode diameter and the mean diameter.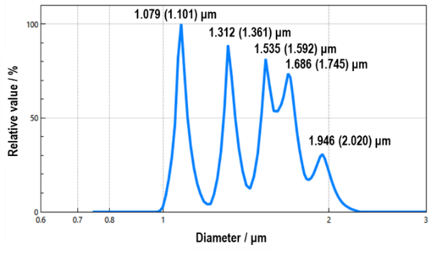
Figure 4 Volume-based size distribution of 5 mixed PSL particles in the Table 2. ( ) = certified diameter.
TPF-PSL sample shown in Table 3 was measured by the line-start method. This sample was prepared as a mixture of three sizes of particles with the same particle concentration. The three peaks had same size separation from each other. The catalog No.4010A, nominal diameter 1.0 μm PSL standard provided by TFS was used to calibrate. The measurement diameters and the certified diameters are the mean diameters. Figure 5 shows the volume-based size distribution with three peaks, and each measurement diameter agrees well with the certified diameter. The mixing ratio is 30.8/37.1/32.1%, also almost identical. The particle concentration is calculated from the peak area ratio of the measured volume-based size distribution.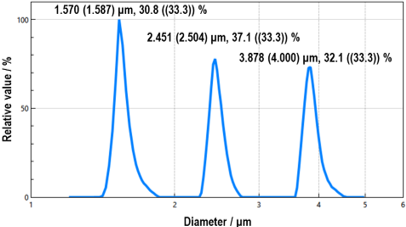
Figure 5 Volume-based size distribution of TPF-PSL particles in Table 3. ( ) = certified diameter, (( )) = certified concentration.
The silica slurry was diluted so that the absorbance was about 1.0 with pure water, and the freshly prepared samples were then measured by the homogeneous method. As shown in Table 4, the average mean size is 0.1127 μm, the standard the deviation is 0.0005 μm, and the coefficient of variation is 0.4%. Figure 6 shows the volume-based size distribution for the ten measurement results.
Table 4 Repeatability test (n=10) results
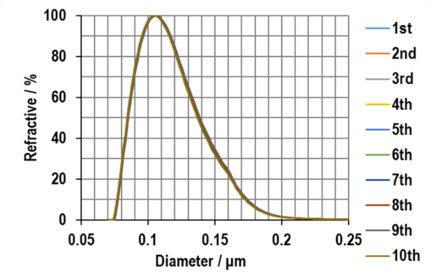
Figure 6 Silica slurry volume-based size distribution
Conclusion
The apparatus was developed to measure the size distribution of nanoparticles in a liquid by using PCLS.
This apparatus was shown to be able to measure poly-dispersed size distribution with high resolution and repeatability. This apparatus can measure the true size distribution regardless of the shape of the distribution. It can be utilized as an evaluation tool for nanomaterials being developed and commercialized in the future.
References
[1] S. Ichimura, Y. Iijima, T. Yamaguchi, M. Kanai, Y. Shirakawabe, K. Ito, and T. Fujimoto, “Expert Series for Analytical Chemistry Instrumentation Analysis”,
2018, Vol.8, Measurement of Nanoparticles, Kyoritsu Publication, Japan.
[2] ISO22412:2017, Particle Size Analysis - Dynamic Light Scattering (DLS)
[3] ISO13318-2:2007, Determination of particle size distribution by centrifugal liquid sedimentation methods - Part 2: Photocentrifuge method
Product & Exhibition information, Contact information
High Resolution particle size distribution Measurement by centrifugation
- Realizing precision particle distribution measurement for undiluted to dilute samples
- Small amounts of foreign particle or agglomeration can be captured
- Features stable measurement even for the long time measurement
For more information about partica CENTRIFUGE, please visit: HORIBA (http://www.horiba.com)
Upcoming Event: 1. JACLaS, 8-10, Oct. (Japan) 2. BioJapan, 13-15, Oct (Japan) 3. HyVolution, 27 - 28 Oct. (France) 4. Testting Expo 26-28, Oct. (USA)
e-Readout Editorial Office:
Research & Development Division, HORIBA, Ltd.
2, Miyanohigashi-cho, Kisshoin, Minami-ku, Kyoto 601-8510, Japan
E-mail : readout(at)horiba.co.jp
