Applications of Ion electrodes
(1) Measurement of potassium contained in various foods
The potassium content of 15 types of foodstuffs was measured using a flame photometer and with a potassium ion electrode. The diagram below shows a comparison between these two methods.*
In the figure, the horizontal axis represents measurements using the flame photometer, and the vertical axis represents measurements with the potassium electrode. They show a high level of agreement (correlation coefficient r = 0.99, n = 15). These values indicate the amount of potassium in mg contained in 100 g of sample.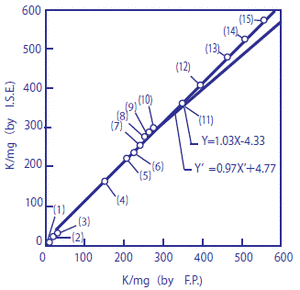
Figure 1 Measurements of amount of potassium contained in foodstuffs
X-axis: Flame photometer; Y-axis: Potassium ion electrode
The amount of potassium contained in the following 15 types of foodstuffs and beverages were measured: (1) grape juice, (2) alkali ion drink, (3) sports drink, (4) milk, (5) tomato juice, (6) cucumber, (7) ham, (8) potato, (9) cabbage, (10) Worcester sauce, (11) banana, (12) soy sauce, (13) tomato ketchup, (14) parsley, and (15) soybean paste. Direct measurements were performed on specimens (1), (2), (3), and (4) following pH-adjustment, without them being diluted. Before carrying out measurement, around 1 g of each of specimens (5) to (15) was diluted 100 times. Amongst these, specimens (5), (7), (10), (12), (13), and (15) were pH-adjusted, and hydrochloric acid was added to diluted specimens (6), (8), (9), (11), and (14), making 1%-hydrochloric acid solutions which were then neutralized with sodium hydroxide.
The solid food samples were thoroughly mashed using an agate mortar prior to performance of the treatments described above.
* T. Miyazaki, and T. Aomi, “Determination of the potassium content of foodstuffs using a potassium ion selective electrode,” Electrochemistry, vol.52 (8), pp.521–523, 1984
In response to requirements at the time, many types of ion electrodes have been used as the detectors in dedicated specific ion meters. The following are examples:
- T. Miyazaki, and T. Aomi, “Salt meter for foodstuffs using a sodium ion selective electrode,” Electrochemistry, vol.49 (10), pp.657–659, 1981
- “Salt meter for ready-mixed concrete aggregate (sea sand) using a chloride ion selective electrode,” Measurement of salt in concrete for technology evaluation: No. 860402, Japan Institute of Construction Engineering; applicant: Horiba, Ltd.; 1986
- The following literature relates to measurement of electrolyte ion concentration in blood using sodium ion, potassium ion, and chloride ion electrodes:
H. Nose, E. Sugimoto, T. Morimoto, S. Usui and T. Aomi, Jpn. J. Phy. 36. 607–611, 1986
H. Uematsu, T. Kono, S. Usui, and T. Aomi, Electrochemistry, vol.55 (7), pp.532–535, 1987
“Potassium and sodium ion analyzer,” Japan patent registration announcement No. 1982-32771 (Assignee: Horiba Ltd.; Inventors: Kenji Yoshino, and Takashi Aomi; Applied for in 1976)
Ion selective electrodes are stipulated in JIS K 0122: General rules regarding ion selective electrode methods. (Confirmed in 2006)
(2) Measurement of salt content in processed foods using a sodium ion selective glass electrode
The following two figures compare the salt content (salt equivalents) in processed foods measured by using a sodium ion selective glass electrode against those measured by the titration method (Mohr method) and sodium flame photometry.
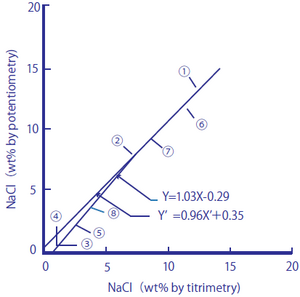
Figure 2-1: Comparison between Salt Content in Processed Foods Measured by the Titration Method and the Sodium Ion Electrode Method
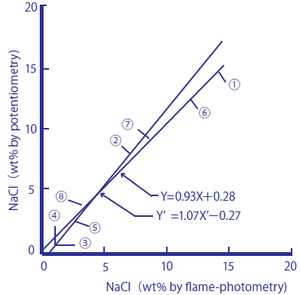
Figure 2-2: Comparison between Salt Content in Processed Foods Measured by Flame Photometry and the Sodium Ion Electrode Method
The processed foods used were ① soy sauce, ② Worcester sauce, ③ tomato juice, ④ vegetable juice, ⑤ the liquid from canned tuna flakes, ⑥ miso, ⑦ cod roe, and ⑧ tomato ketchup. As samples, 1.00 cm3 of ① and ②, 10.0 cm3 of ③, ④, and ⑤, and 1.00 g of ⑥, ⑦, and ⑧ were taken, and pure water was added to them until the total amounts of the sample solutions reached 100 cm3. The measurement values are shown in percent by weight (wt.%).
Figure 2-1 Regression line
y=1.03X-0.29 and y'=0.96 X’+0.35 obtained
The correlation coefficient is y=0.99(n=8)
Figure 2-2
y=0.93X+0.28 and y'=1.07X'-0.27 obtained
y=0.99 (n=8)
These processed foods contain monosodium glutamate and other substances that produce sodium ions in addition to salt. The measurement results obtained by the titration method, which measures chloride ions, agreed well with those obtained by the sodium ion selective glass electrode method, and it is assumed that many of the sodium ions contained in the processed foods come from salt in the measurement range. The measurement results obtained by sodium flame photometry method agreed well with those obtained by the sodium ion selective glass electrode method, and it is assumed that the processed foods have low potassium ion content, which affects measurements with a sodium ion selective glass electrode.
* Takashi Aomi and Takeshi Miyazaki, “Electrochemistry,” 49 (10), pp. 657 to 659 (1981)
(3) Monitoring minute amounts of sodium ions in boiler water at thermal and nuclear power plants
As an industrial application of ion electrodes, we will explain about the monitoring of minute amounts of sodium ions.
Steam drives the power generation turbines at both thermal and nuclear power plants. The steam is then cooled by external water (mainly seawater) via heat exchangers and eventually condensing to become boiler water once again.
If pin holes occurred in the heat exchanger, these would result in a minute amount of seawater getting into the boiler water. A minute-quantity sodium ion monitor with an Na+ electrode as the detector is used to watch for this.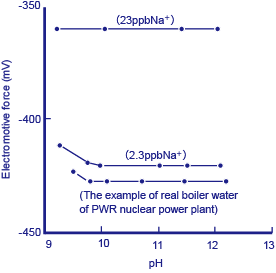
Figure 3 Example of measurement of a reference solution and actual boiler water using a minute-quantity sodium ion monitor
Reference solutions of 10-6M (23 ppb Na+) and 10-7M (2.3 ppb Na+), together with actual boiler water were measured using a minute-quantity sodium ion monitor. The above diagram* shows the results. Prior to carrying out measurement, an amine solution was added to the reference and sample solutions in order to make them strongly alkaline as a protection against obstruction by hydrogen ions. Although around 0.6 ppb of Na+ was detected in the actual boiler water, since it is difficult to prepare reference solutions correctly at this level of concentration, this value cannot be claimed to be accurate. However, even a small amount of seawater getting into the boiler water causes a sudden change in this value, and immediately sets off a warning alarm indicating that pin holes may have developed in the heat exchanger (cooler).
* “Sodium ion concentration measurement system,” Japanese utility model application and registration announcement No.: 1990-10456 (Assignee: Horiba Ltd.; Inventors: Shigeyuki Akiyama, and Takashi Aomi; Applied for in 1982)
(4) Measurement of fluoride ions in effluent-treated semiconductor etching solutions
Semiconductor etching solutions contain hydrofluoric acid. After being effluent-treated by adding calcium hydroxide, they are measured for fluoride ion content then reused within the factory. (In general, semiconductor factories employ a closed system that avoids the outside discharge of waste water.)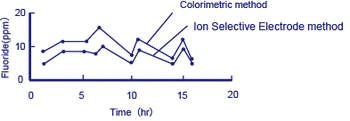
Figure 4 Example of measurement of fluorides in processing water
This above diagram shows an example of measurements obtained using the colorimetric method, and with a fluoride ion selective electrode method equipped with an F- electrode acting as the detector.*
The colorimetric method measures fluorine atoms in the bound state (e.g. F in CaF2) by distillation of a test solution, while the ion selective electrode method detects free F- only. Although the measurements from the two methods differ (the colorimetric method showing higher concentrations), the trend that they follow agrees well.
In the effluent treatment of solutions that contain fluorides, precipitated CaF2 is removed, so it is important to detect the concentration of free F- ions.
* T. Aomi, “Ion selective electrodes and applications,” JSR, No.3, pp.14–21, 1981
Next page Categorization of Ion electrodes by response membrane