PDF
1.12
MB

Turbidity Measurements in the Flavours Industry

Turbidity measurement is widely used as an indicator in the flavour industry to evaluate manufacturing and process performance. Flavour extract samples were analysed by comparing turbidity levels before and after filtration using HORIBA’s TB220, achieving measured values as low as 0.04 NTU. A clear reduction of turbidity was demonstrated after filtration, enabling objective and quantitative assessment as compared to operator-based visual judgement.
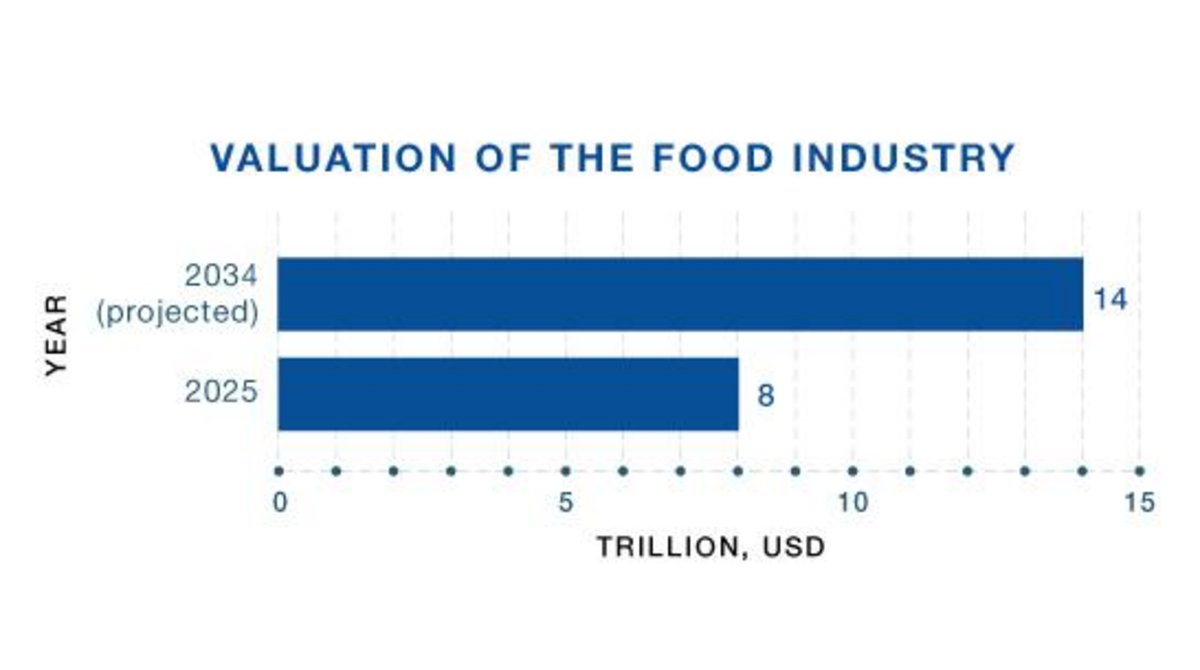
The food industry plays a crucial role in our daily lives, providing the food that is essential for our nutrition and well-being. It spans a wide range of activities, from food preparation, manufacturing of processed food products and beverages, to their subsequent distribution to retailers and consumers1. It is one of the world’s most significant economic sectors, being valued at over USD 8 trillion in 2025, and is projected to hit USD 14 trillion by 20343.
Figure 1: Valuation of the Food Industry, in trillions (USD)
This growth is driven by shifting consumer trends, towards more health-driven consumption, convenience lifestyles, as well as sustainable and ethical choices2. This makes food safety even more important in today’s context, as any compromise in safety standards not only affects the reputation of the manufacturer or producer, but also leads to serious health consequences in consumers4. One approach used by manufacturers to support food safety, particularly in beverage and liquid ingredient production, is through monitoring of product turbidity.
Turbidity is a measure of relative fluid clarity, with higher turbidity resulting in lower fluid transparency. It is caused by suspended particles in solution, some of which are invisible to the naked eye. In food safety, turbidity measurement can provide valuable insights into production processes, like detecting changes in filter efficiency or identifying potential quality deviations. Routine testing can help identify filter degradation or fouling, thus preventing unwanted particulates from entering the final product.
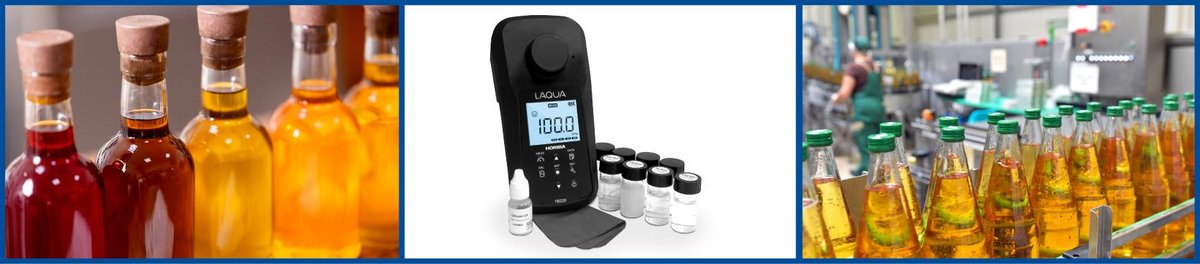
This is highly relevant in the flavour manufacturing industry, as visual clarity serves as a primary quality check, influencing the consumer’s perception of safety and overall product desirability. During the production of oil based flavour emulsions, turbidity can be used to monitor dispersion quality and detect process deviations such as inadequate emulsification or the presence of unwanted particulates because of compromised filtration performance5. By doing so, manufacturers can verify that processes are operating as intended and identify deviations at an early stage, allowing corrective action to be taken before ingredient delivery or product integration. Quantified in Nephelometric Turbidity Units (NTU), HORIBA’s newest turbidity meter – the TB220 – provides rapid and reliable turbidity measurements to support process monitoring and quality control. Its ratiometric measurement principle compensates for issues such as optical noise or external sources of interference, ensuring stable and repeatable readings even under challenging process conditions. In flavour manufacturing, the TB220 enables users to effectively assess filter performance, monitor product quality, and detect abnormal turbidity levels which may indicate contamination or process deviations5.
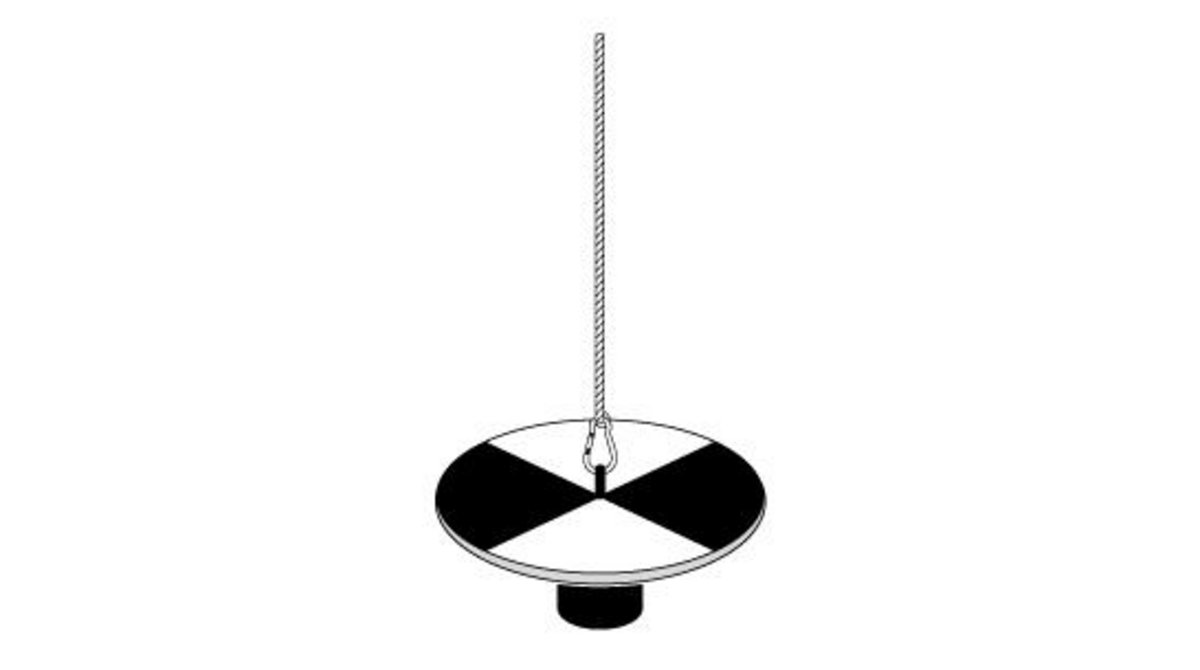
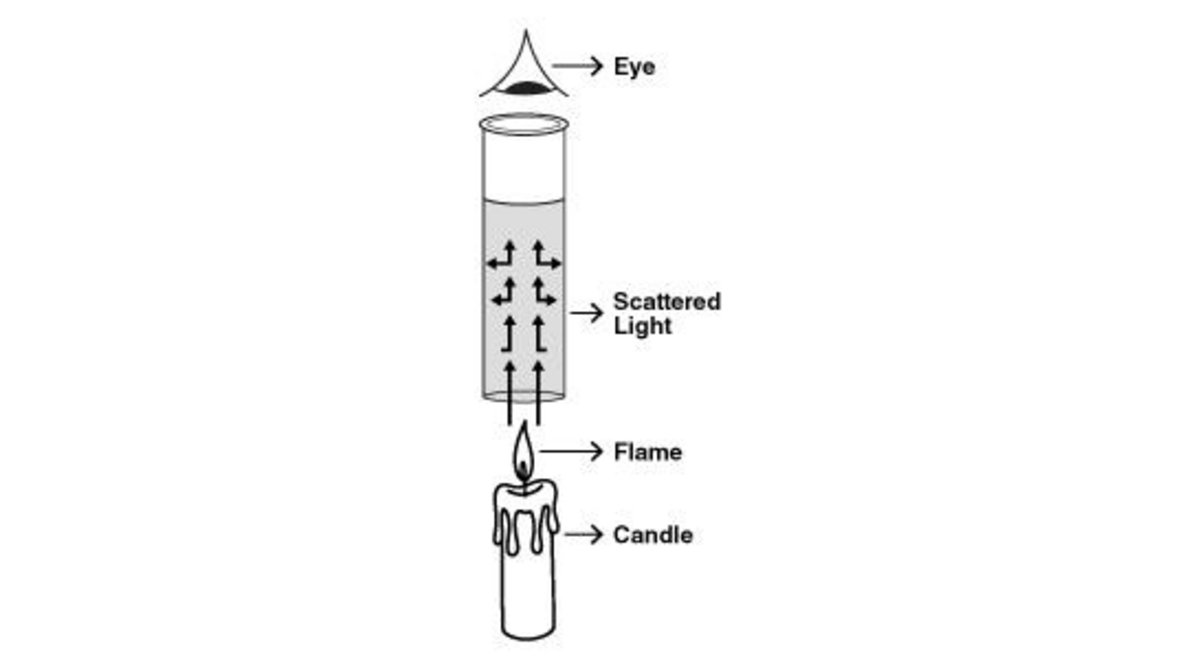
Historically, turbidity was assessed using visual methods such as the Secchi Disk and the Jackson Candle technique. While useful, these methods were inherently limited, as they relied on the operator’s experience and ability to visually detect obscured light within a sample6. This reliance often resulted in subjective interpretations and variability between operators. The TB220 addresses these limitations by enabling quality thresholds to be empirically determined and expressed in standardized units5. By providing objective, quantitative turbidity data, the TB220 removes operator bias5 and improves the reliability and repeatability of quality assessment, increasing confidence in quality control decisions.
Figure 2: Image of Secchi Disk
Figure 3: Image of Jackson Candle Method
The TB220 was calibrated in accordance with the manufacturer’s instructions before use, using the standard solutions provided in the meter kit to ensure measurement accuracy. If the value shown during the calibration is more than ±10% of the standard’s value (±0.03 NTU if 0.02 NTU solution is used), we recommend replacing with fresh standard solution. Calibration was then verified via a calibration check, with acceptable readings defined as ±2% (for 20, 100 and 800 NTU solutions), or ±0.02 NTU (for 0.02 NTU solution).
Three flavour extract samples were collected from a flavour manufacturer to evaluate filtration performance by comparing turbidity measurements before and after filtration. Previously, filtration performance had been assessed via operator-based visual judgement of sample clarity. To improve reproducibility and minimise the impact of human error, the manufacturer sought to use the TB220 to obtain objective, quantitative turbidity data before and after filtration.
In addition, the portable design of the TB220 allowed turbidity measurements to be carried out across multiple manufacturing sites, supporting flexible quality assessment without reliance on fixed laboratory equipment. By doing so, this eliminated the need for sample transport as the meter could be brought directly to the sample rather than transferring samples to a benchtop turbidity meter in a fixed location. As a result, sample handling was minimized and the risk of condition-related changes – such as temperature fluctuations or agitation – was reduced, helping to preserve sample integrity and improve measurement consistency, as turbidity measurements are known to be influenced by factors such as temperature7.
From Figure 4, turbidity measurements obtained using the TB220 showed a clear reduction in turbidity values after filtration across three different flavour extract samples. In contrast to previous operator-based visual assessments, the TB220 provided quantitative data that enabled direct comparison of samples before and after filtration for evaluation.
These results highlight the benefits of replacing subjective visual judgement with instrument-based turbidity measurement. By enabling empirically defined quality thresholds5 and providing consistent, repeatable data, the TB220 improves confidence in the assessment of filtration performance. Additionally, its portable design allows measurements to be performed directly at the point of sampling across different manufacturing sites, reducing sample handling and minimizing environment-related changes that could otherwise impact measurement accuracy7.
| 1 | YM Packaging. (n.d.). Food industry: Characteristics, sectors and challenges. Retrieved April 21, 2026, from https://ympackaging.com/en/food-industry-characteristics-sectors-challenges/ |
| 2 | True Grade. (2024, January 10).2026 food & beverage industry market trends. https://truegradefoods.com/2026-food-beverage-industry-market-trends/ |
| 3 | The Business Research Company. (2024, January 25). Food and beverages market size to reach $9,225.27 billion by 2028. Yahoo Finance. https://finance.yahoo.com/news/food-beverages-market-size-reach-133000592.html |
| 4 | Ayuray Organics. (2024, February 24). How beverage companies ensure food safety standards. https://ayurayorganics.com/how-beverage-companies-ensure-food-safety-standards/ |
| 5 | Flavorist.com. (2026, April 27). Turbidity measurement in the flavor industry: Principles, applications, and critical evaluation. https://www.flavorist.com/turbidity-measurement-in-the-flavor-industry-principles-applications-and-critical-evaluation/ |
| 6 | Matos, T., Martins, M. S., et al. (2024). A review of methods and instruments to monitor turbidity and suspended sediment concentration. Journal of Water Process Engineering, 64, 105624. https://doi.org/10.1016/j.jwpe.2024.105624 |
| 7 | Shi, M., Ma, J., & Zhang, K. (2022). The impact of water temperature on in-line turbidity detection. Water, 14(22), 3720. https://doi.org/10.3390/w14223720 |
Revision 0, 8 June 2026