PDF
0.63
MB

Heme Insights 9_November 2026_HORIBA
Explore an acute myeloid leukemia case and learn how CBC results, blood smear morphology, and hematology analyzer flags can reveal warning signs of AML.

A 64-year-old female attended her primary care provider with symptoms of tiredness with no previous medical history of note. A complete blood count (CBC) and C-reactive protein (CRP) test were performed.
The results are shown below:
| WBC 65.9* (10^3/mm3) | MCH 34.4 (pg) |
| RBC 2.58* (10^6/mm3) | MCHC 35.4 (g/dL) |
| HGB 8.9* (g/dL) | PLT 154 (10^3/mm3) |
| HCT 25.1* (%) | CRP 212 mg/L |
| MCV 97.0 (fL) |
An urgent blood smear review was requested.
The manual differential was as below:
| Neutrophils 7.7 | Basophils 0.5 |
| Lymphocytes 5.3 | Blasts 20.2 |
| Monocytes 21.2 | Erythroblasts 7.2 |
| Metamyelocytes 0.5 | Large platelets 3.4 |
Comment
Microscopic examination showed a strikingly abnormal picture:
In short, it is an acute myeloid leukemia (AML) (probably acute myelomonocytic leukemia) with significant dysmorphia.
RBC abnormalities
Nucleated red blood cells: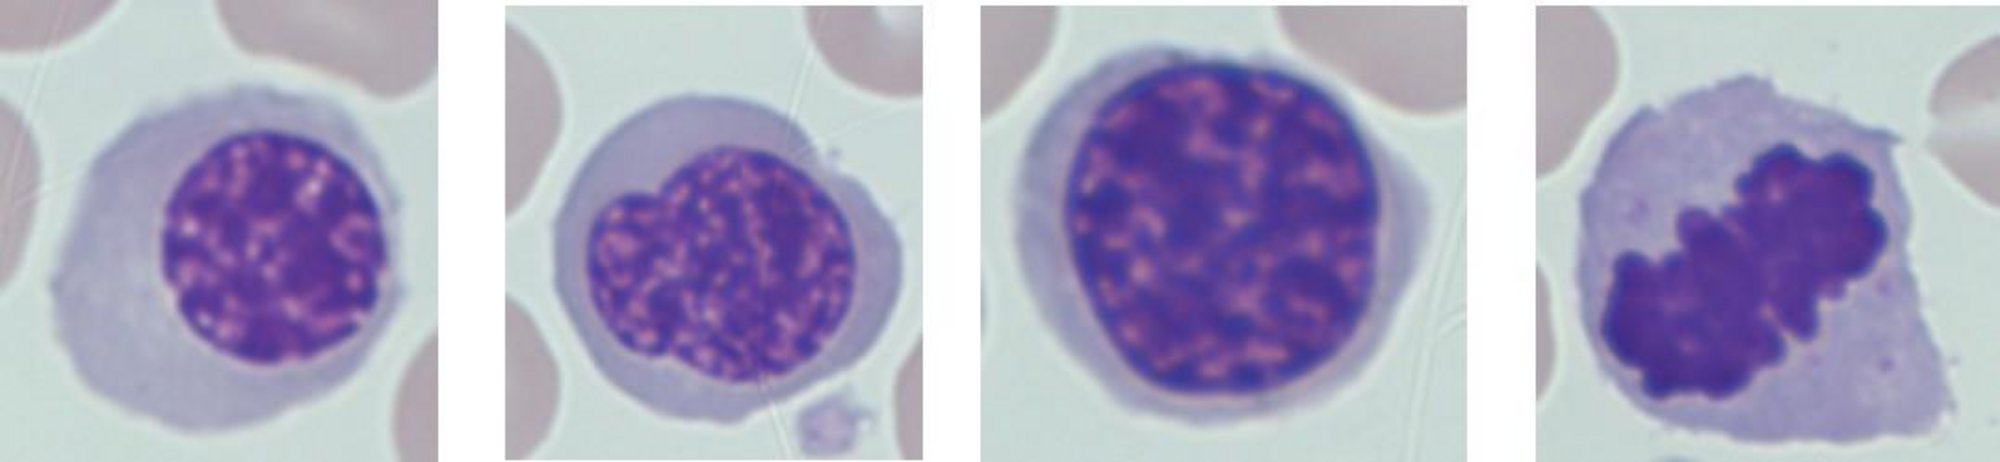
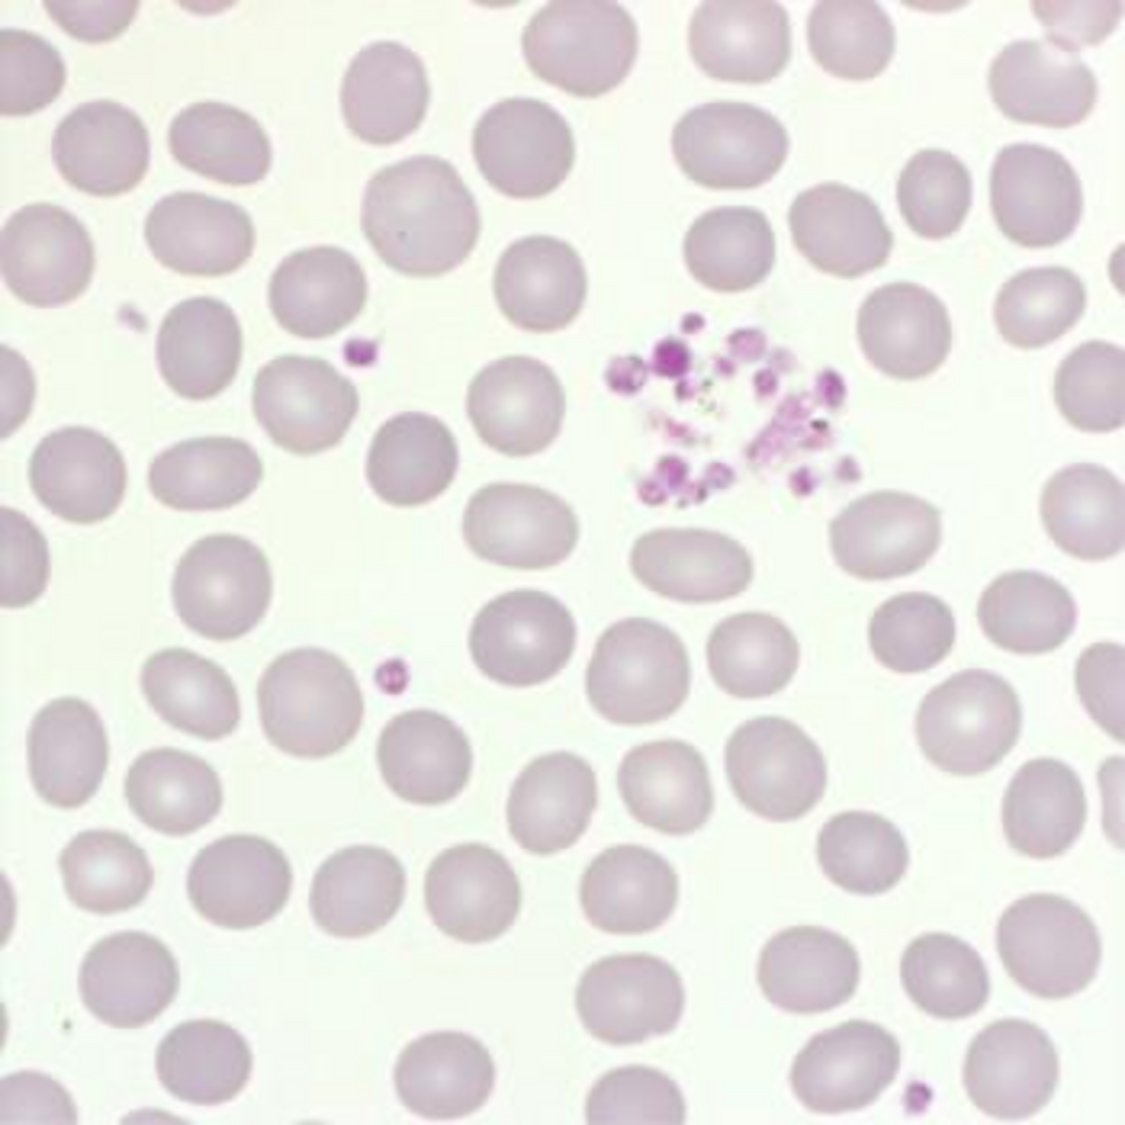
The platelet lineage was also abnormal, with circulating micromegakaryocytes and platelet dysmorphism:
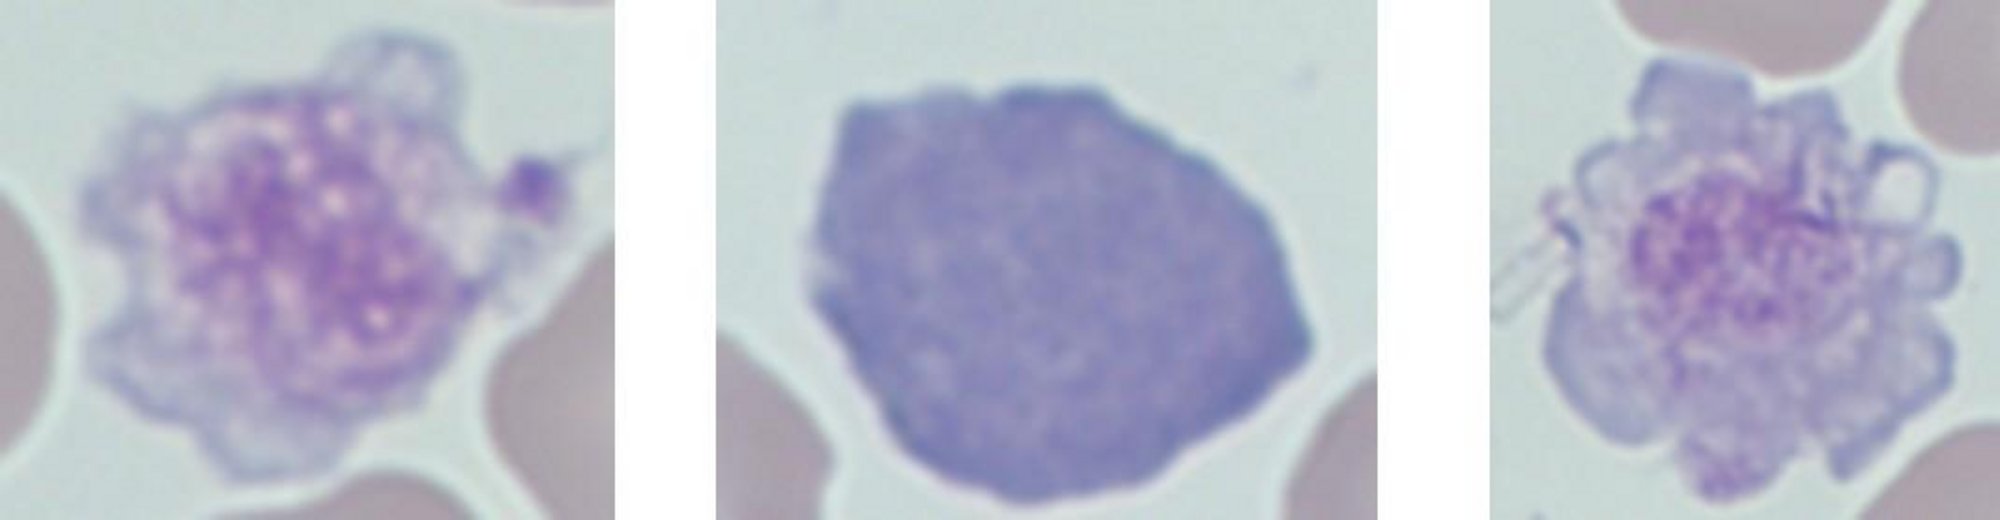
The white cell population provided the most important clue. There was a significant monocytic population together with numerous blast cells. Most importantly, some of the blasts contained distinctive needle-like cytoplasmic inclusions:
Blast cells:
Auer rods are abnormal aggregates of primary granules found within myeloid blast cells. Their presence provides an important morphological clue that the abnormal cells are of myeloid origin.
Monocytes: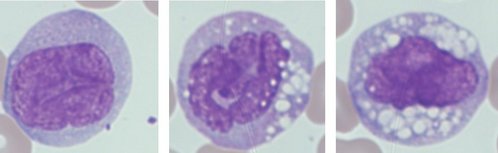
Suggested additional investigations
Although the blood smear provides vital clues, further testing is required to fully classify acute leukemia.
The next investigations would typically include:
An automated hematology analyzer cannot diagnose acute myeloid leukemia (AML) on its own, but it can play an important role in identifying an abnormal sample and ensuring that the sample receives further investigation.
Consider the clinical case in this edition:
The first warning signs were already present in the complete blood count: marked leukocytosis and significant anemia. The next challenge for the analyzer is determining whether the increased white cell population looks normal.
While HORIBA Yumizen hematology analyzers count white cells, they also analyze cell volume and optical extinction, allowing different white cell populations to be separated and displayed graphically. When abnormal or immature populations appear where they would not normally be expected, the analyzer can alert the laboratory to investigate further. On the Yumizen H500 and H550 hematology analyzers, the extended differential includes additional immature white cell populations, including:
This scattergram is from a case study of a patient with AML2. The abnormal cell populations are visible in regions 1 and 2.
Together, these parameters and blast flags support the early recognition of abnormal white cell populations that require further investigation.
For a sample such as the one in our Case Study, unusual cell distribution or immature cell flags provide an important early warning. This isn't simply a high WBC. Look more closely.
For higher-volume laboratories, the Yumizen H2500 hematology analyzer provides additional tools designed to assist with abnormal cell recognition. The analyzer can generate alerts including Blast Suspicion, Abnormal Matrix, Atypical Lymphocyte Suspicion, and Immature Cells. It also provides automated nucleated red blood cell (NRBC) enumeration, which is particularly relevant to this case, where erythroblasts were clearly visible on the peripheral blood smear. These parameters and flags can help laboratories identify samples requiring microscopic review quickly and consistently.
The important point is that an analyzer flag is not a diagnosis. Instead, the workflow becomes:
In our clinical case, morphology provided the crucial additional clue: Auer rods within some blast cells. That finding cannot simply be replaced by a numerical result. It demonstrates why modern automated hematology and traditional morphology are complementary rather than competing technologies.
A patient’s EDTA sample gives a platelet count of 41 × 10⁹/L. The analyzer flags possible platelet clumps, and the blood smear shows aggregates. What is the most appropriate next step?
a) Request a correctly collected citrate sample and analyze it promptly.
b) Report severe thrombocytopenia immediately.
c) Issue a normal platelet result based on the smear estimate.
d) Ignore the clumps and repeat the EDTA count the next day.
The Answer: b)
The extensive platelet clumping suggests that the low EDTA platelet count may be falsely reduced due to pseudothrombocytopenia. Repeating the test using sodium citrate can help prevent EDTA-dependent aggregation and provide a more reliable result. The citrate blood smear should also be checked to confirm that the clumping has resolved, and the result should be reported according to the laboratory’s validated procedure.