Process Control and In-situ Measurement for Photovoltaic Manufacturing Process

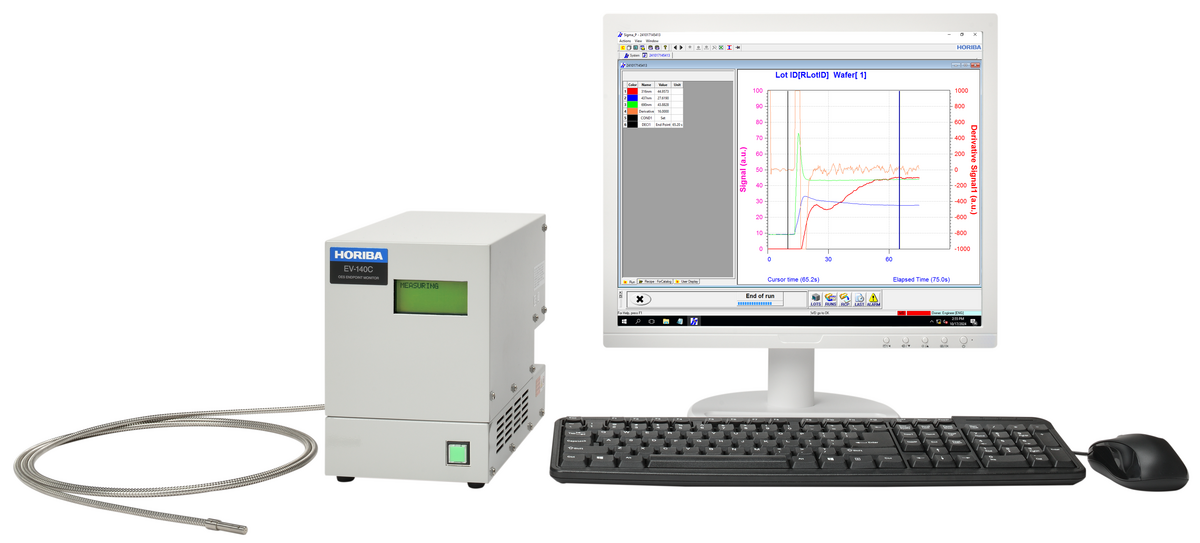
Optical Emission Spectroscopy Etching End-point Monitor
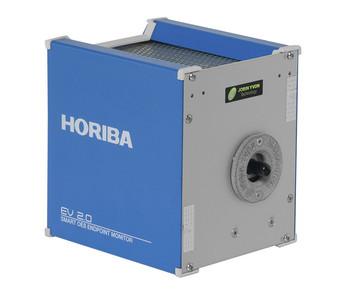
This emission analysis type end-point monitor is intended for end-point detection or plasma condition control in the plasma-based semiconductor thin-film process. The in-house developed Rapture Intensity algorithm allows accurate end-point detection by capturing faint signal changes. The ability of capturing subtle changes in emission has significantly improved the sensitivity. The enhanced noise immunity ensures highly stable operation in hostile environments of round-the-clock manufacturing lines.
A bright optical system is achieved by the use of a large, aberration-correcting concave grating of 70 mm in diameter manufactured by HORIBA Jobin Yvon. The light-gathering ability of the concave grating itself enables the construction of a simple optical system that is brighter than Czerny-Turner spectroscopes and that can minimize the reflection loss caused by mirrors and other reflective surfaces.
A back-illuminated CCD achieves high quantum efficiency, ensuring stable spectroscopy in the broad spectrum from UV to visible regions. The highly sensitive measurement possible in the UV region, in particular, enables end-point detection in the wavelength range which is less affected by interference.
This software executes a variety of steps required for process control, from the analysis of plasma behavior to the creation of databases of measured data and remote control of manufacturing equipment.
The programmable structure of the measurement recipe enables setting of multiple detection conditions and sequential processing. This allows the monitor to be used not only for end-point applications but also for comprehensive plasma condition monitoring.
This is an advanced setting which warns of abnormal plasma condition as well as conducting end-point measurement using the ratio between two wavelengths.
Once spectroscopy data is obtained, simulation for recipe optimization or end-point detection can be repeated as desired by applying new recipe conditions.
A library used to identify the emission species in plasma is included as standard.
Spectroscopy data can be converted into a time course graph, or can be displayed freely on the screen using screen layout, operation waveforms, and comparative calculation waveforms against reference data, and other information.
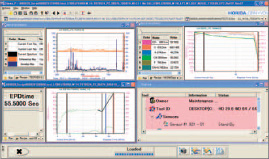
It is a daunting challenge to find minute pattern changes from an enormous amount of spectrum data with noise. Auto Pattern automatically finds characteristic pattern changes to determine the optimum end-point wavelength.
End-points can be accurately detected by using the user-specified wavelength-to-wavelength calculation waveform and filtering. The newly-developed Rapture Intensity algorithm allows constant monitoring of the changes in the intersecting angle between the two straight lines which approximate the two specified sections. This ensures that points of change are differentiated appropriately from noise without delay, and that extremely small signal changes such as end-points with small opening areas, are accurately detected.
Etching monitoring over a small opening area (<0.2%).
After a frequency filter processes noise from the original signal, the differential signal (pink line) of the ratio (black line) of (rise (A+B+C)/decrease (D+E+F) curve) leads to accurate detection of the end-point.
Recipe Designer is an extended version of the Auto Pattern analysis tool. It allows the user to generate an optimum Rapture Intensity algorithm simply by following on-screen instructions for analysis and simulation. The algorithm can easily be built into the real recipe. This can greatly lighten the load of recipe generation for end-points of weak and complicated emission species or end-points which cannot be detected due to changes in process conditions, or similar cases.
STEP1: Automatic extraction of the pattern of wavelength changes
STEP2: Identification of the point of change using the approximation of two straight lines
STEP3: The EDP simulation conducted by Rapture Intensity and the completed algorithm can be exported and built into Sigma-P.
The statistical process editor is able to analyze the log data from many different perspectives, helping to improve abnormality analysis and yield rates. The results of the analysis can be fed back to measurements.
| Wavelength range | 200 to 800 nm |
| Optical resolution | <2.0 nm @λ=200 to 500 nm |
| Focal length | 140 mm |
| CCD type | Back-thinned linear CCD image sensor |
| A/D resolution | 16 bit |
| Sampling rate | 20 msec to 2.5 sec |
| Number of connected chambers | 1 ch | |
| AC Power Supply Specifications | Sensor unit size | 142 × 201 × 257 mm (W×H×D), excluding protrusions |
| Sensor unit mass | 5.8 kg | |
| Power supply | AC 100-240 V ±10 %, 50/60 Hz ±3 Hz | |
| Power consumption | 50 VA or less | |
| Operating temperature | 15-35 ℃ | |
| Operating humidity | 80% RH or less | |
Details are available upon request.
| Fiber material | Fused silica fiber |
| Fiber grade | For VIS |
| Fiber length | 2 m or 5 m, specified at the time of order |
| LAN cable | 3 m (between the EV-140C sensor unit and controller unit) |
| Remote protocol | Parallel I/O, TCP/IP, RS-232C, specified at the time of order |
| Chamber adapter | Condensing lens unit |
| Endpoint optimization software | Supported OS:Windows 10, Windows 11(64-bit) |
Windows is a trademark or registered trademark of Microsoft Corporation in the United States and other countries.
Do you have any questions or requests? Use this form to contact our specialists.
Exhaust Pressure Controller
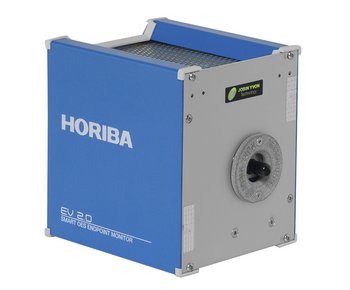
Endpoint / Chamber Health Monitor based on Optical Emission Spectroscopy and MWL Interferometry
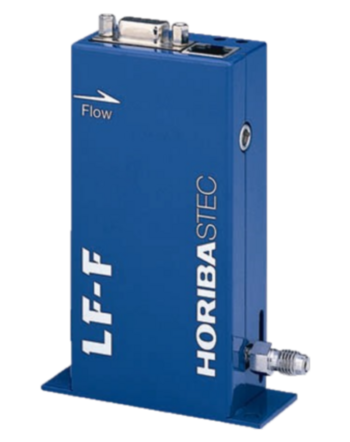
Digital Liquid Mass Flow Meters / Controllers
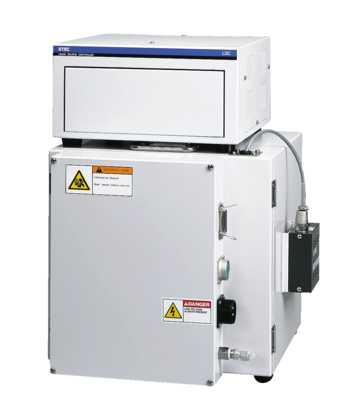
Compact Baking System
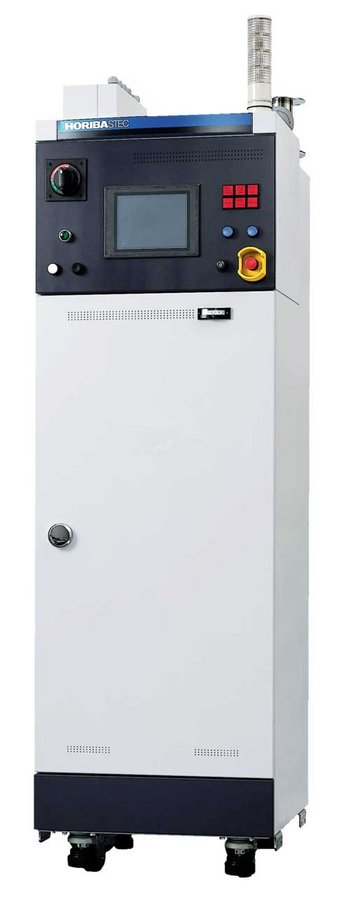
Liquid Auto Refill System
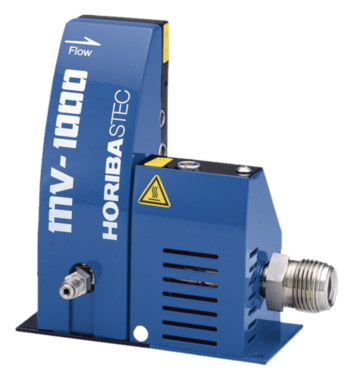
Mixed Injection System Liquid Vaporizers
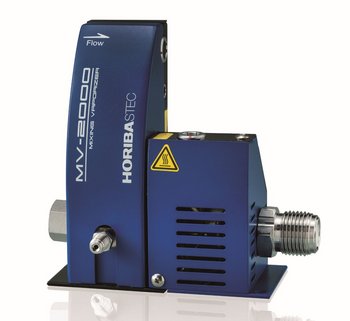
Mixed Injection System Liquid Vaporizer
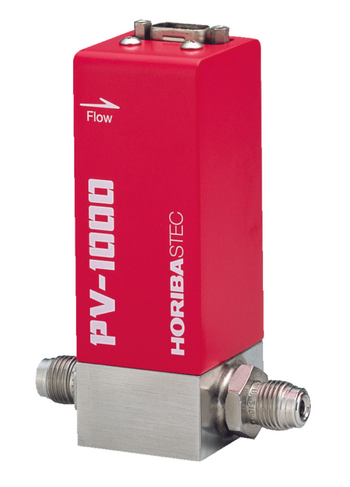
Piezo Actuator Valve
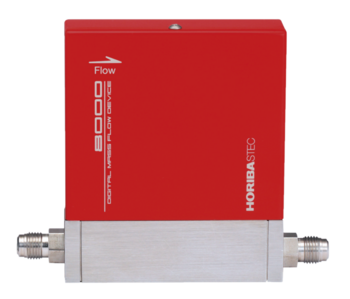
High Temperature Digital Mass Flow Controller
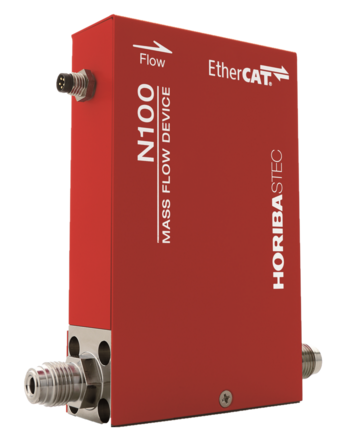
Digital Mass Flow Controller
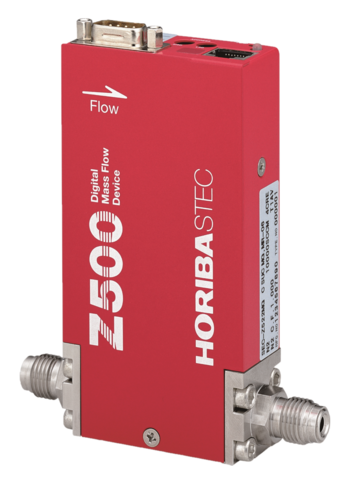
Multi Range/Multi Gas Digital Mass Flow Controller
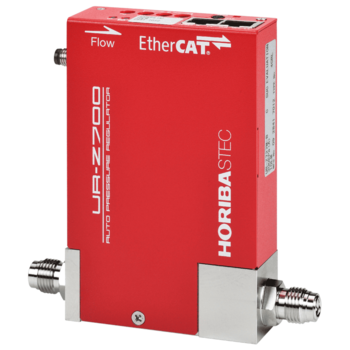
Digital Automatic Pressure Regulator
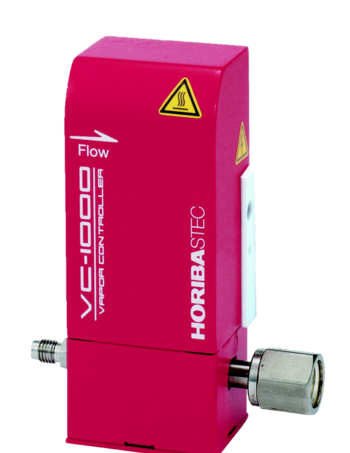
Direct Liquid Injection System
Endpoint / Chamber Health Monitor based on Optical Emission Spectroscopy and MWL Interferometry
Endpoint / Chamber Health Monitor based on Optical Emission Spectroscopy and MWL Interferometry
Pulsed-RF Glow Discharge Optical Emission Spectrometer
Plasma Emission Controller