Plastic is a type of material that is resistant to degradation and is practically indestructible. While plastic will break down into fragments and fragments will become microplastics (1 µm to 5 mm*) and become nanoplastics via photo-oxidative mechanisms, plastic fundamentally remains the same throughout the process. Nanoparticles can gain access through inhalation, ingestion, or dermal exposure and have greater cellular uptake than those bigger in size. Nanoparticles subsequently pose a greater impact on health. The concern of water contamination from nanoplastics (≤ 1 µm) is, therefore, a study receiving close scrutiny from FDA and EPA alike.
* Size-based nomenclature per Section 116376 of the State of California Health and Safety Code
One of the proven methods of tackling microplastics applications is the use of Raman spectroscopy. Raman spectroscopy allows chemical identification of organic and inorganic particles, giving clues to the origins of the plastic. When Raman is coupled with ParticleFinder, the subsampling of microplastics by particle size and shape can be automated well within the software. HORIBA Scientific offers a microplastics solution; click to read the latest development and academic collaboration on Microplastics Analysis.
Particles smaller than 1 µm, however, are tedious and difficult to quantify using spectroscopy or other traditional techniques. In a recent publication, Yang et al used the ViewSizer 3000 multispectral Nanoparticle Tracking Analysis (m NTA) technique to study transport of microplastics from ocean to atmosphere via sea spray aerosolization. The experiment utilized m NTA’s ability to accurately count particles in a complex environmental matrix, and in so doing, refuted the popular belief that ocean contributes to the majority of plastic in air.
Published Paper: Constraining Microplastic Particle Emission Flux from the Ocean | Environmental Science & Technology Letters (acs.org)
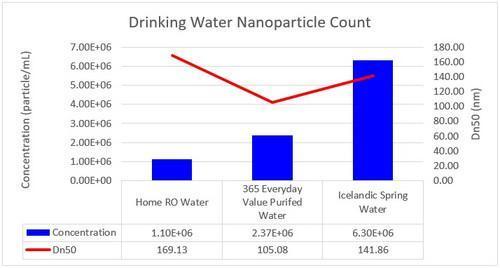
While counting only plastic nanoparticles among all other materials in water is still an application in progress involving proper particle staining procedure, here we offer examples of nanoparticle counts in three drinking water sources:
- Home reverse osmosis filtered water (where water is forced through membranes to remove impurities) collected in a glass vial
- 365 Everyday Value purified water (plastic bottle)
- Icelandic Glacial spring water (plastic bottle)
The analysis workflow is straightforward. 500 µL of water was transferred directly from the source to the measurement cell. Three simultaneous operating lasers (635 nm, 520 nm, 445 nm) were then used to collect and track particles until a statistically significant number of particles were collected over 50 videos or approximately 30 minutes. The analyses below are average results of triplicates. It demonstrated that although bottled water is marketed as cleaner and superior, the data beg to differ. Home RO water shows the lowest nanoparticle count overall compared to its similarly filtered water from 365 Everyday Value. Icelandic Spring Water contains the highest number of particles per mL.

