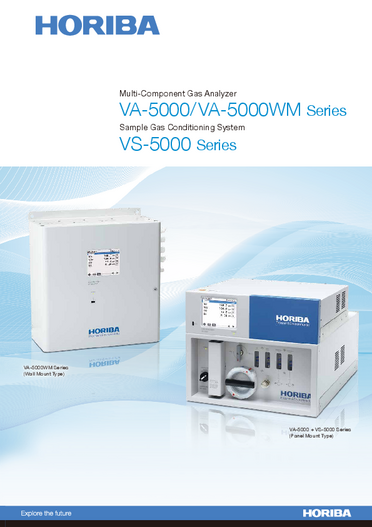

Nitrous Oxide Monitoring for Greenhouse Gas Reduction
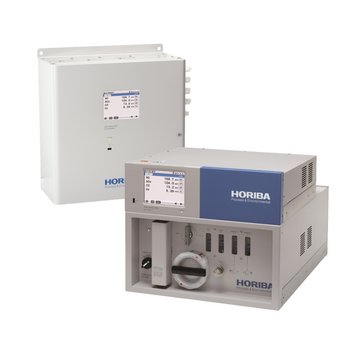
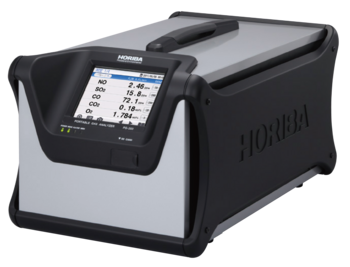
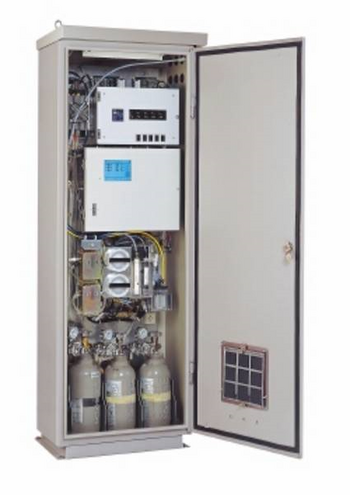
HORIBA’s highly accurate gas analyzers represented in various types from stationary to portable, contribute to the environment protection and GHG (green house gas) emissions mitigation by quantification of N2O, CH4 emissions from wastewater treatment plant
Wastewater treatment plants (WWTPs) are a significant source of greenhouse gas (GHG) emissions. The primary GHGs of concern are methane (CH4) and nitrous oxide (N2O). CH4 dissolved in the influent is released to the atmosphere during the aeration process*1. Other wastewater treatment stages that can generate CH4 emissions include open stabilization lagoons and sludge gravity thickeners. N2O emissions mainly occur during aeration and nitrification-denitrification processes when operational conditions are not optimized.
Based on the Global Anthropogenic Non-CO2 Greenhouse Gas Emission Report*2, CH4 emissions from WWTPs are projected to rise by 3.5 percent (from 588.0 to 608.8 MtCO2e) and N2O emissions by 3 percent (from 96.8 to 99.8 MtCO2e) between 2025 and 2030. Given that the global warming potential (GWP) of N2O is 273 times and non-fossil CH4 is 27 times that of CO2*3, and considering the fact countries worldwide have committed to Net-Zero targets, accurate, real-time measurement of these gases is critical. Real-time CH4 and N2O monitoring enables operators to optimize operational performance and enhance corporate reporting accuracy and reduce carbon-credit cost.
The international methodology for quantifying emissions is established by IPCC*2 Guidelines in Tier 1, Tier 2, and Tier 3 methods. The default emission factors used in Tier 1 and Tier 2, which were established by IPCC, can substantially under or overestimate actual GHG emission, hindering wastewater treatment optimization and accurate reporting. For reaching more accurate GHG emission estimation, countries with advanced methodologies and reliable data follow Tier 3, using country specific methods*2. As a result, many universities and wastewater treatment plants in developed countries are currently engaged in research, measurement campaigns, and formulation of national measurement guidelines and country specific methods.
One significant challenge faced by operators is the accurate measurement of N2O and CH4 emissions. Even if a real-time analyzer is installed on site, moisture and co-existing gases present in the sample gas may cause cross-interference with CH4 and N2O, affecting accuracy. Only by overcoming this challenge through careful selection of instruments can achieve truly accurate real-time CH4 and N2O monitoring and contribute to treatment optimization and development of effective GHG emission abatement strategies by WWTPs.
*1 The 2019 Refinements to the 2006 IPCC Guidelines for National Greenhouse Gas Inventories Chapter 6 Wastewater Treatment and Discharge
*2 Global Anthropogenic Non-CO2 Greenhouse Gas Emissions: 1990-2030 (Revised Dec.2012) Office of Atmospheric Programs Climate Change Division U.S. Environmental Protection Agency
*3 Global Warming potential values from the IPCC Sixth Assessment Report, 2020 (AR6)
(IPCC: The Intergovernmental Panel on Climate Change)
The concentration of N2O and CH4 emissions varies significantly depending on the time of day, season, water temperature, load and water treatment process. For accurate quantification and the consideration of GHG abatement strategies, we need reliable real-time measurement.
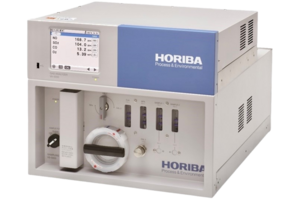
The analyzer is equipped with interference compensation as a standard function to minimize cross-interference
Available with simultaneous measurement of up to 4 components by one unit (Example: N2O, CH4, CO2 and O2*)
* In design with 4 components, oxygen measurement technology is fixed to Galvanic.
Stream-switching for monitoring multiple sampling points reduces hardware and maintenance costs
Specification
| Gas Measured | N2O | CH4 |
| Measurement ranges | 0 - 50 ppm (min.), 0 - 5000 (max.) | 0 - 100 ppm (min.), 0 - 100 vol% (max.) |
| LDL* | 0.1 ppm | 0.4 ppm |
| Repeatability | ±0.5% of full scale | ±0.5% of full scale |
| Linearity | ±2% of full scale | ±2% of full scale |
| Zero drift (day) | ±2.0% | ±2.0% |
| Span Drift (day) | ±2.0% | ±2.0% |
*LDL: Lower Detection Limit
如您有任何疑問,请在此留下詳細需求或問題,我們將竭誠您服務。