Wafer

LabSpec 6 App for easy and ergonomic characterization of wafers

“Wafer” is a LabSpec 6 application dedicated to the Raman analysis of wafers (up to 300 mm diameter) enhancing the capabilities of the LabRAM Odyssey Semiconductor. ”Wafer” faciltates and speeds up Raman and photoluminescence analysis of semiconductor wafers. The wafer app delivers visual and statistical data ready to use for process optimization, failure diagnostics, and pass/fail decisions.

Key benefits:

  • Facilitates whole wafer mapping acquisition
  • Allows automation of data processing
  • Delivers automatically data as wafer images and statistics table


Check out our LabSpec 6 Video Resource Center to fully master your LabSpec 6 spectroscopy software!

事業部: Scientific
產品分類: Raman Spectroscopy
製造商: HORIBA France SAS
  • Precise stage positioning for loading sample and analysis: the app automatically moves the stage to a safe loading position, then centers the sample for measurement with a single click.
     
  • Creation of acquisition and analysis templates: the user can build personalized templates to instantly restore preferred settings and ensure consistent, repeatable workflows.
     
  • Versatile sampling schemes: the app supports full‑map scans, 49‑point patterns, grid sampling, stars and more—while allowing users to set scan parameters and select the most suitable autofocus mode.
     
  • Various autofocus modes: the app offers multiple autofocus modes—reflection, spectral, pre‑recorded topography, or mid‑scan tilt correction—allowing users to select the optimal compromise between acquisition time and accuracy.
     
  • Easy zoom‑area selection:  the app allows to locate and scan a specific grid region from a pre‑recorded full‑wafer map for precise defect inspection.
     
  • Real‑time analytics supported by multiple visualization: The system applies template‑specified conditions to process data in real time and outputs results across multiple visualization formats—maps, histograms, and statistical tables—to accelerate analysis.
     
  • Instant, customizable reporting: the app generates tailored reports on the spot, including optional statistical summary tables and histogram visualizations
     

Intuitive user interface, with all features easily accessible
(49 point sampling pattern shown)
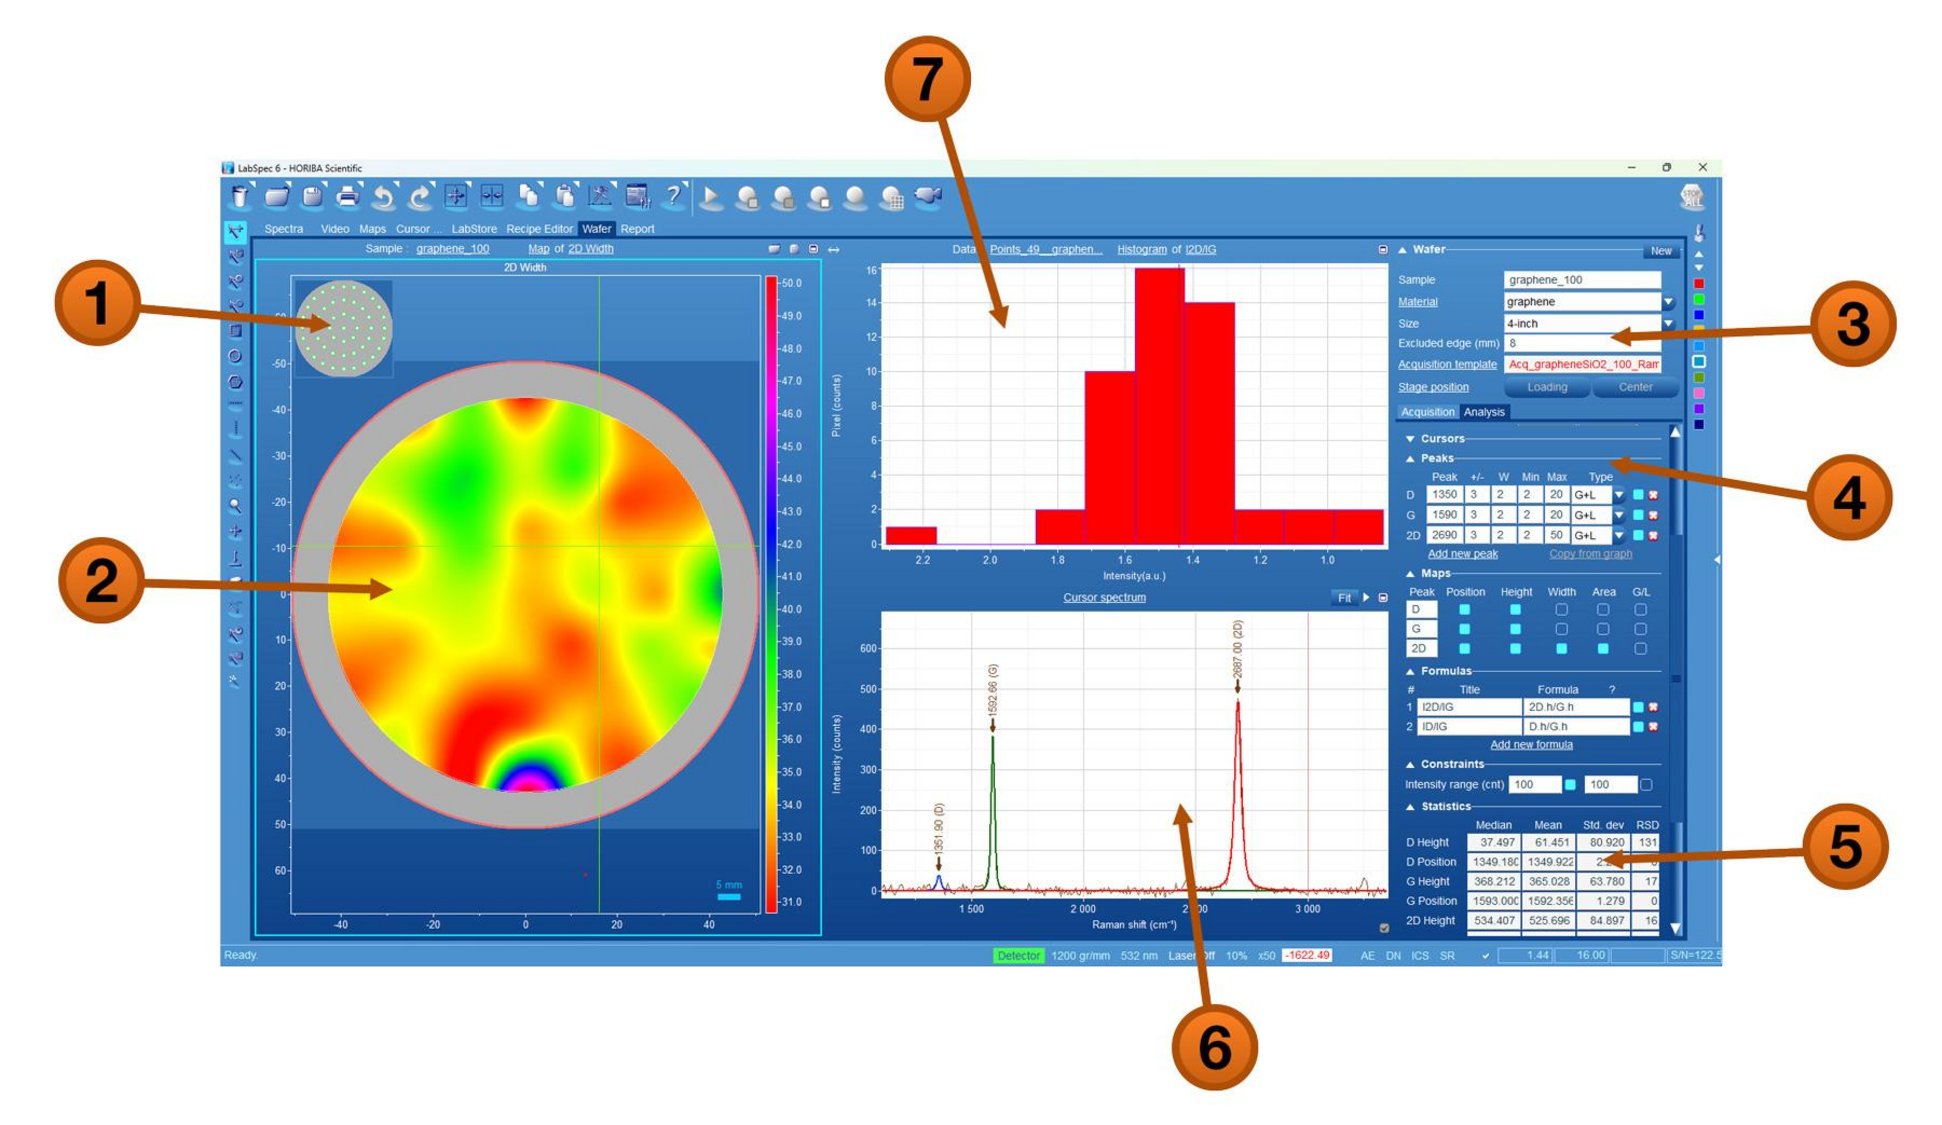
1. Sampling pattern
2. 2D width intensity map
3. I2D/IG width histogram
4. Selected point spectrum
5. Sample definition
6. Acquisition and analysis parameters
7. Statistical table


Instant, customizable reports can be generated

留言諮詢

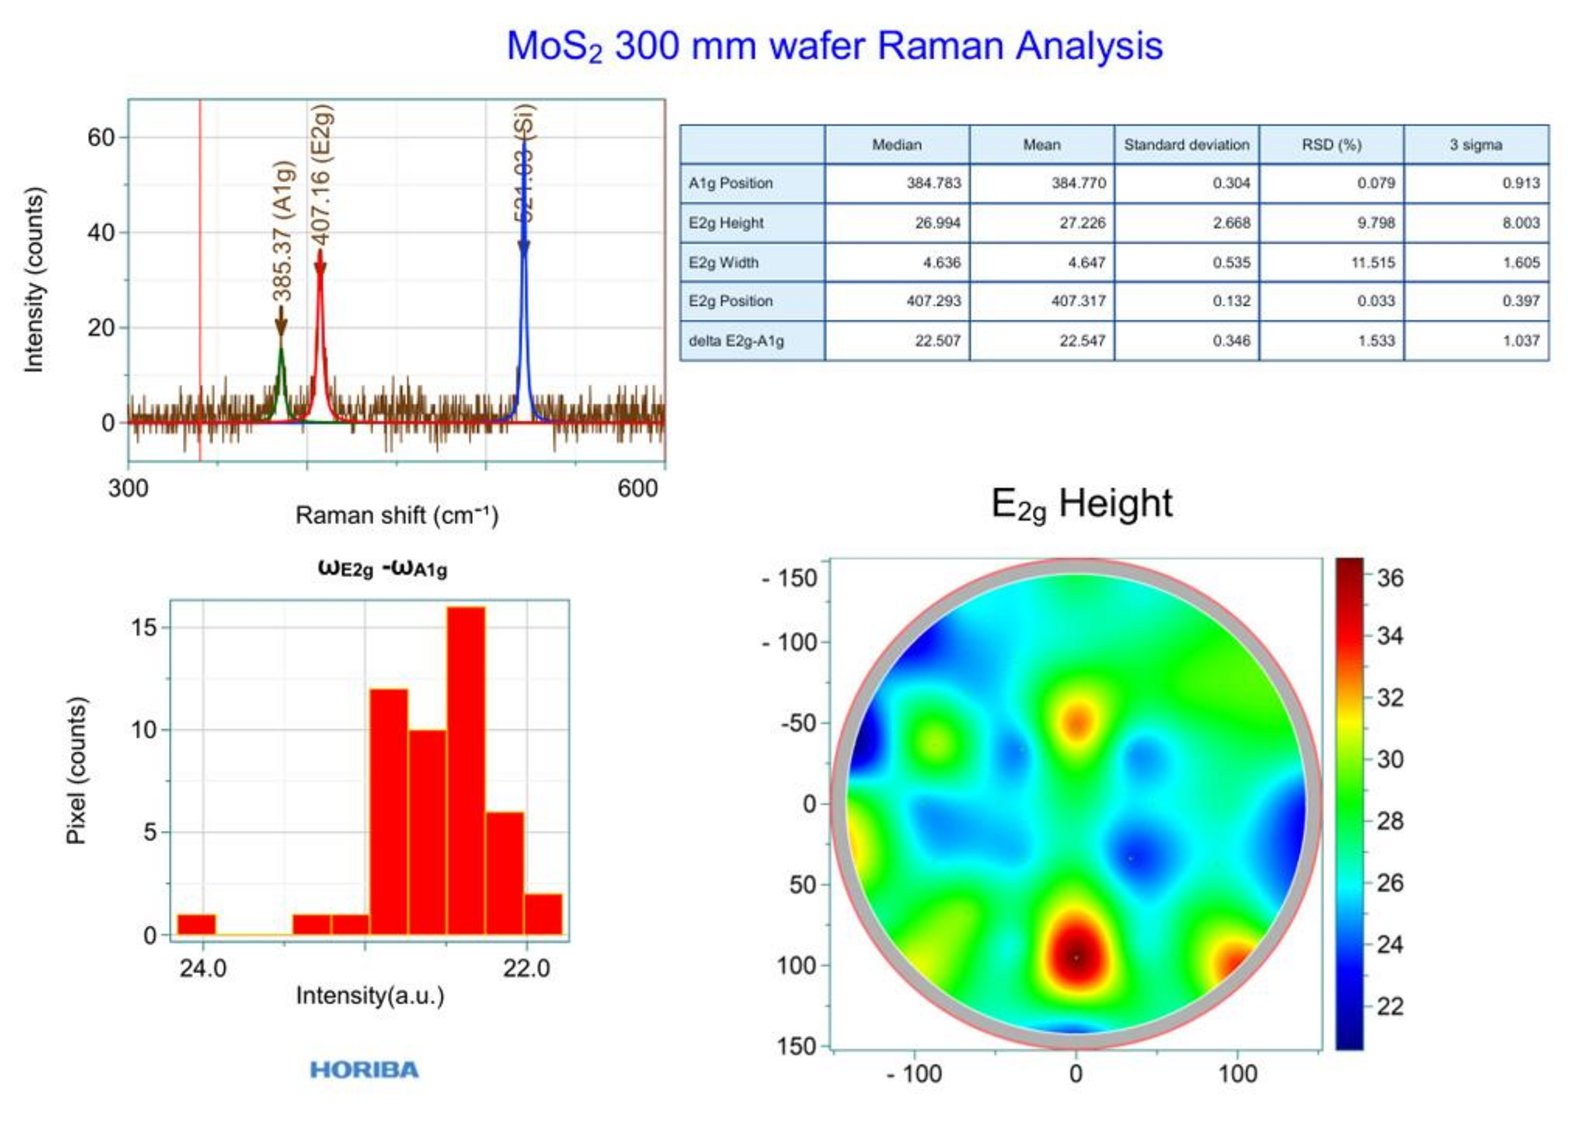
如您有任何疑問,请在此留下詳細需求或問題,我們將竭誠您服務。

* 這些欄位為必填項目。