PDF
0.56
MB

Turbidity Monitoring of Treated Water using the LAQUA TB220 Meter

A sample of treated water taken from a water treatment plant in Singapore was found to have an average of 0.14 NTU using the TB220, which is comparable to the average historical turbidity reading of that treatment facility of 0.15 NTU.
Water is the most important resource on Earth, and it is the cornerstone of survival and function1. Animals use it as a source of protection and peace, whereas humans have created ways to traverse across water and to utilise it for recreational purposes. Thus, it is an essential component for all living life, the environment, as well as industry and economy. This forms the basis for monitoring and protecting the quality of our water, to ensure a sustainable future for both humans and ecosystems alike as it is a finite resource. Water quality can be determined by several indicators, such as physical, chemical, and biological. Some examples include pH, conductivity, colour, dissolved oxygen, and turbidity.
Turbidity is a measure of how clear or cloudy a liquid is, and it is caused by suspended particles in solution which might sometimes be invisible to the naked eye. It is a key indicator of water quality especially in environmental monitvoring, as high turbidity in water bodies and water sources could be a result of any number of the following factors: natural (soil erosion, algal blooms), human (agricultural runoff, construction activities) or water systems-related issues (pipe corrosion, improper filtration).
The following factors can cause high turbidity in water bodies and water sources: natural (soil erosion, algal blooms), human (agricultural runoff, construction activities) or water systems-related issues (pipe corrosion, improper filtration).
High turbidity is detrimental, as it not only affects the quality of our drinking water and rendering our drinking water unsafe for human consumption, but it also affects aquatic ecosystems, which in turn could lead to even greater problems for the ecosystem.
Turbidity is expressed in terms of Nephelometric Turbidity Units (NTU) and is typically measured by using a turbidimeter. A light source directs light into the sample, and the suspended particles present in solution scatter the source beam. A detector positioned perpendicular to the source beam then picks up the scattered light. If there are more particles present in solution, there is an increased propensity for light to be scattered, which results in more light reaching the detector. This can then be interpreted as a higher turbidity level of the sample.
The graph below shows some turbidity values that are to be typically expected by different sources of water2,3,4:
Figure 1. Expected turbidity readings (NTU) by different sources of water

The LAQUA TB220 Turbidity Meter is the latest addition to the LAQUA 200 series of handheld water quality meters. Similar to other meters in the 200 series family, the TB220 features a large backlit monochrome display, a simple and straightforward user interface with smiley face reading stability indicator and has a robust shock- and scratch-resistant construction that is rated IP67-waterproof (excluding sample vial chamber). It sees applications in various fields, from water quality testing, research laboratories, to industrial water treatment monitoring.
What is unique about the TB220 and sets it apart from other turbidimeters available is the fact that it leverages on a ratiometric measurement principle, using nephelometric light scatter and transmitted light signals. This means that the meter readings are calculated based on a ratio of scattered and transmitted light signals.
The advantages of using this measurement principle are:
TB220 meter kit: 0.02, 20, 100, and 800 NTU Styrene Divinylbenzene (SDVB) polymer solution standards, 4 sample vials, and a set of silicone oil and cloth in durable carrying case for routine water quality testing.
Calibrate the TB220 Meter with the 4 calibration standards provided in the meter kit, in accordance with manufacturer’s instructions.
Step One
1.
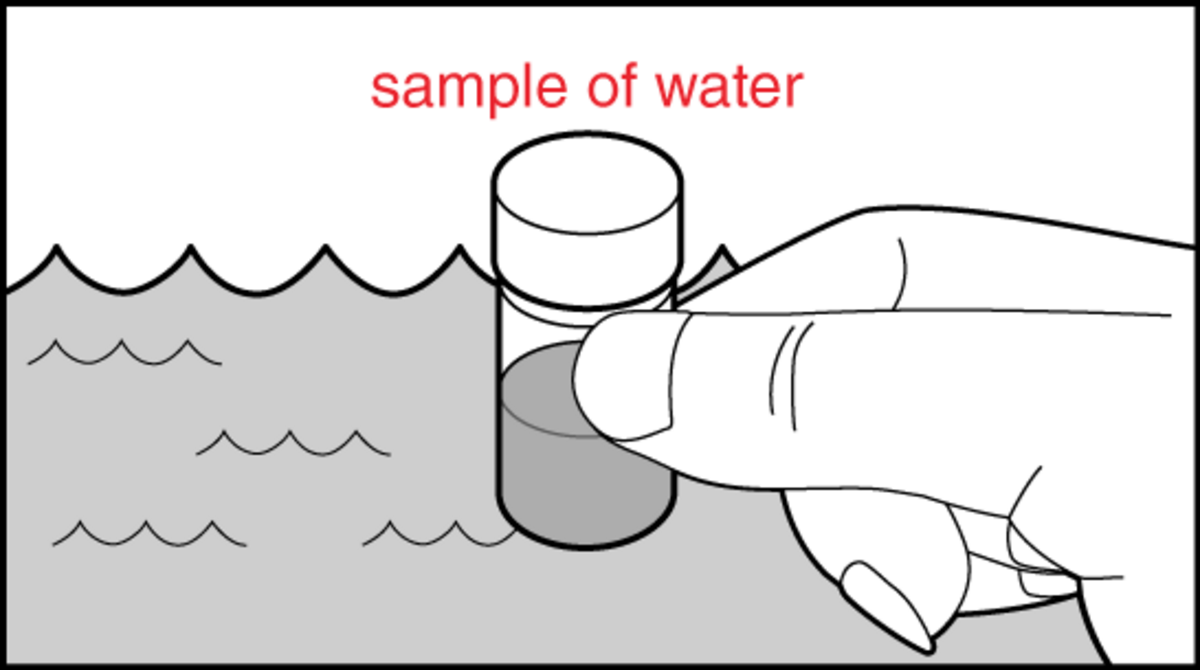
Collect a representative sample of water to be tested in a clean bottle or container.
Step Two
2.
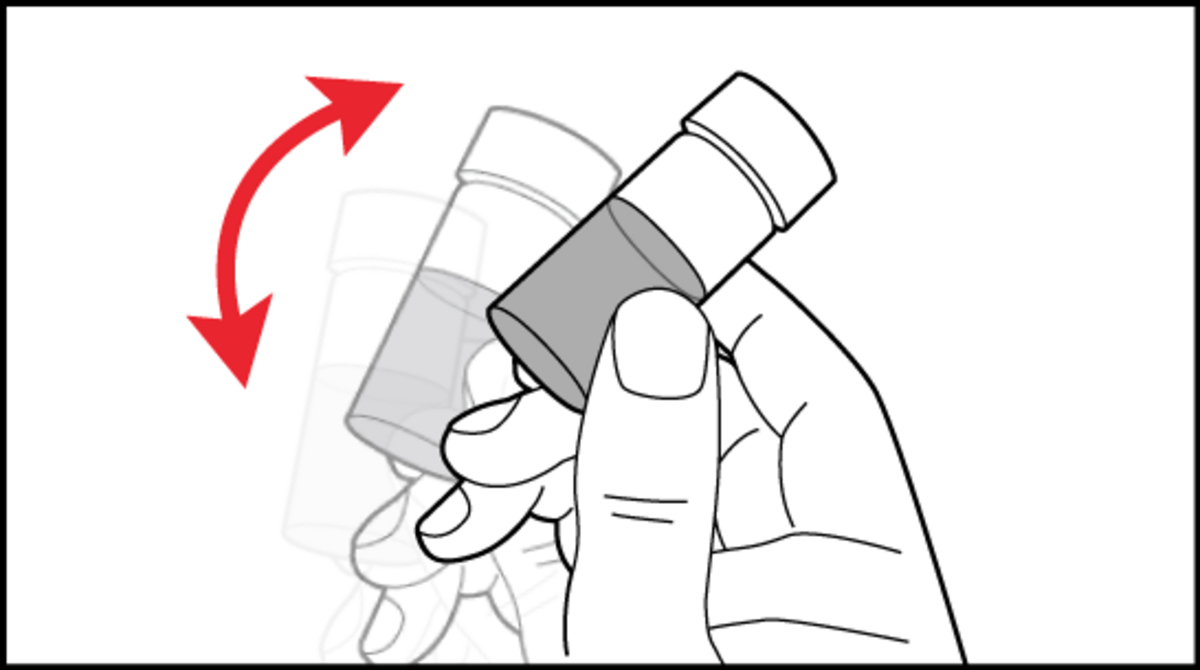
Gently mix sample by inversion to re-suspend any settled particles to avoid introducing air bubbles.
Step Three
3.
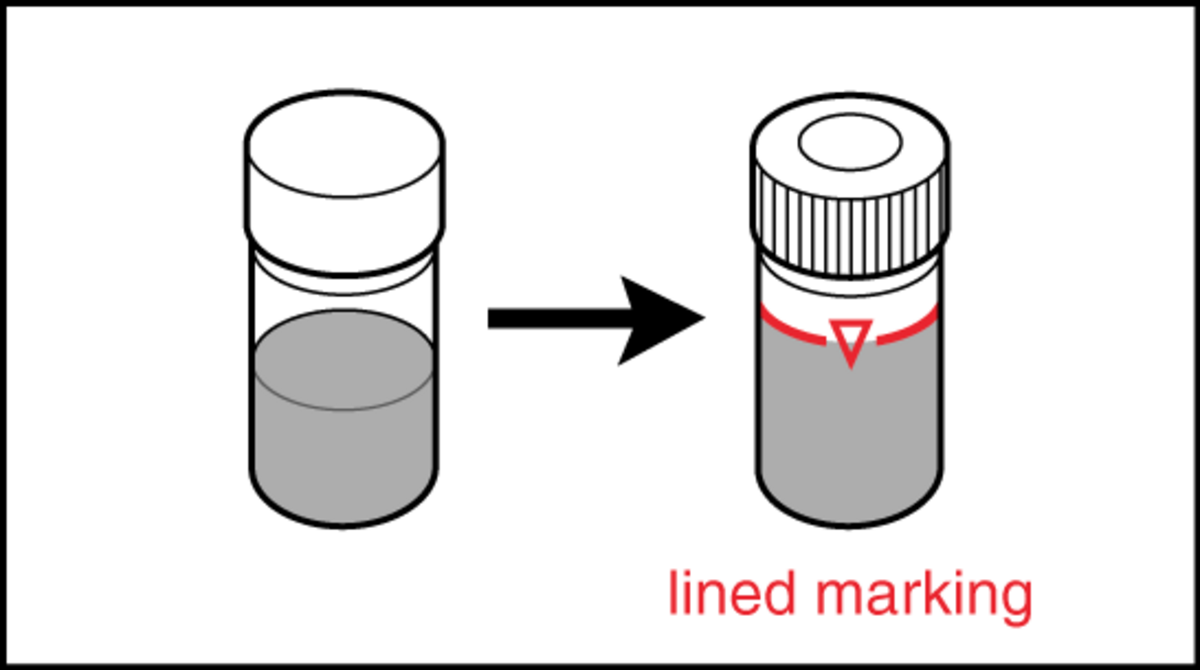
Rinse the sample vial with collected sample at least 2 times and discard, before filling vial with enough sample to reach the line marking on the vial (about 10mL). Invert the vial gently to get rid of any air bubbles if necessary.
Step Four
4.
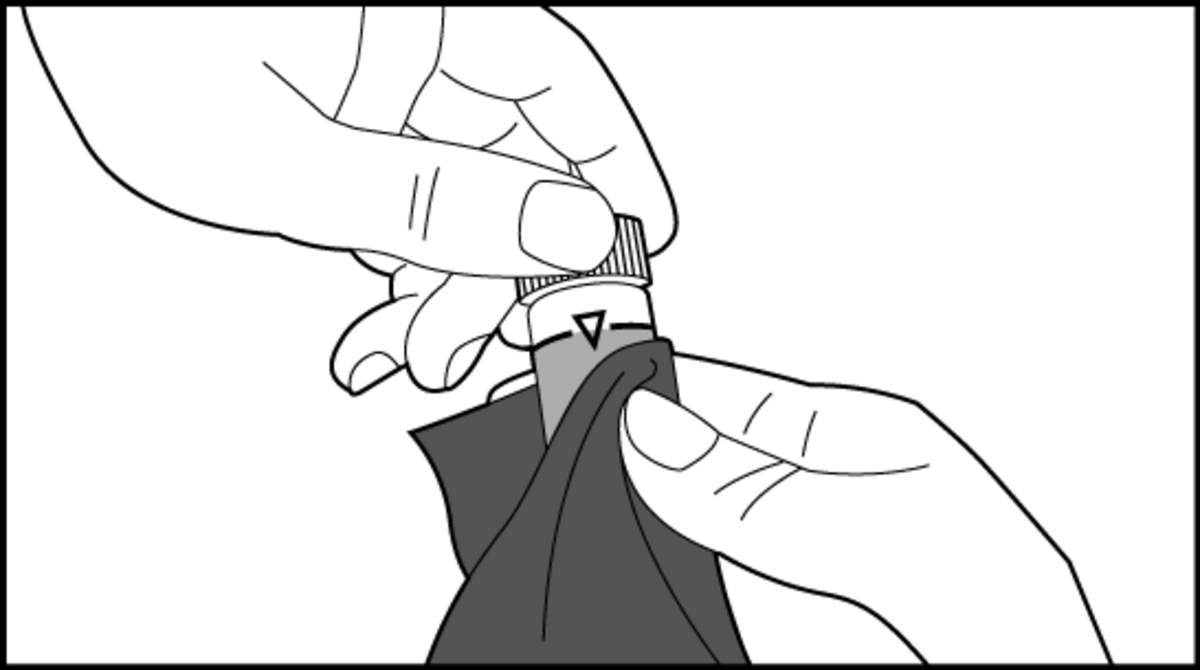
Use the provided microfibre cloth to clean the vial surface before measurement.
Step Five
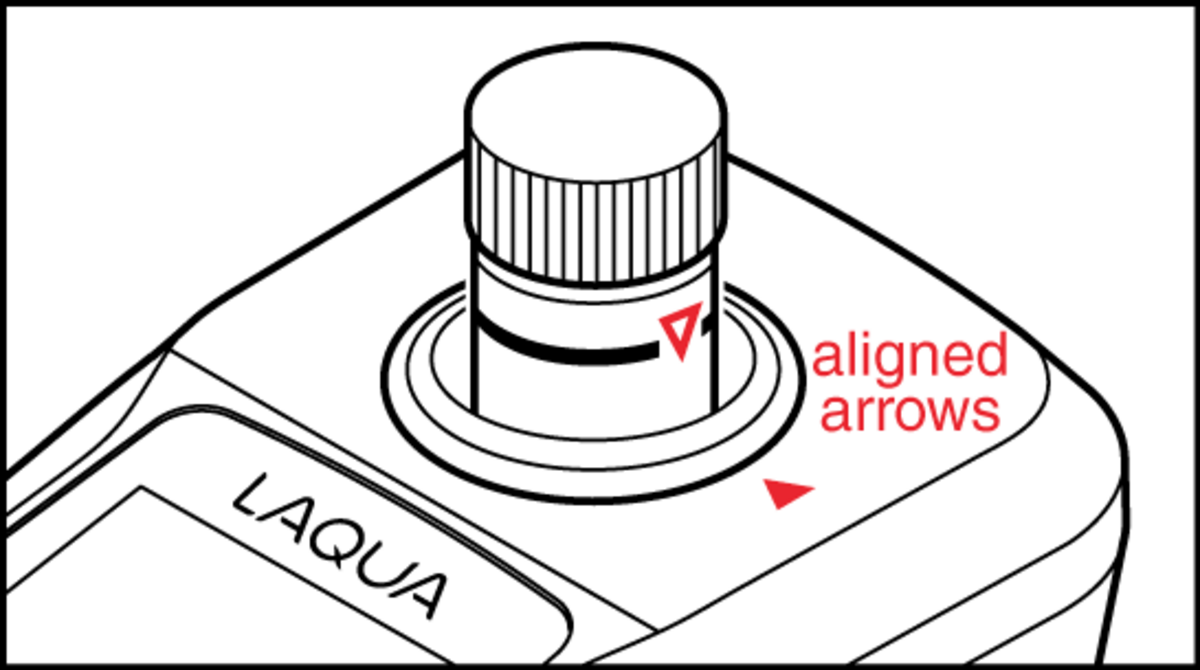
5.
Align the arrows on the sample vial and the meter itself and cap it with the vial cover.
Step Six
6.
Allow the vial to rest for 30 seconds to 1 minute for the turbidity to stabilise before performing measurement.
Samples of treated water at a water treatment facility in Singapore was collected and tested using a 4-point calibrated TB220 meter. The average turbidity was determined to be 0.14 NTU, based on triplicate readings of 0.21, 0.11 and 0.10 NTU. This result agrees well when compared against the facility’s real-time process monitoring of turbidity via their inhouse sensors, which yielded a reading of 0.17 NTU. This average reading (0.14 NTU) also falls well within the historical range of observed turbidity at the water treatment facility, which has been reported to be 0.06 – 0.42 NTU, with an average of 0.15 NTU.
The table below is a summary of the turbidity values.
Figure 2. Summary of turbidity values at treatment facility
| Historical | Sampled | |
| Water Treatment Facility in Singapore | 0.06 – 0.42 | 0.17 |
| Sample Taken at Water Treatment Facility in Singapore | – | 0.14 |
| 1 | Hydronation International Centre Scotland. (2025, October 17).Why water is the most important resource. |
| 2 | U.S. Environmental Protection Agency. (2025, July 1). Turbidity provisions. https://www.epa.gov/dwreginfo/turbidity-provisions EPA |
| 3 | Fondriest Environmental, Inc. (2014, June 13). Turbidity, total suspended solids & water clarity: Fundamentals of environmental measurements. https://www.fondriest.com/environmental-measurements/parameters/water-quality/turbidity-total-suspendedsolids-water-clarity/ Fondriest Environmental |
| 4 | Wikipedia contributors. (n.d.). Turbidity. In Wikipedia. Retrieved October 22, 2025, from https://en.wikipedia.org/wiki/Turbidity Wikipedia |
Revision 0, 5 November 2025