Aqualog A-TEEM compared to traditional scanning PMT fluorometers
Traditional scanning spectrofluorometers have been used to collect a molecular fingerprint, in the form of a fluorescence excitation emission matrix, or EEM. Sometimes also referred to as 3D Fluorescence, an EEM is a three-dimensional data set of fluorescence excitation wavelength versus fluorescence emission wavelength versus fluorescence intensity. With a scanning spectrofluorometer, this data set is acquired by sequentially scanning a series of emission spectra, at varying excitation wavelengths, and then reconstructing the resultant data set three dimensionally. This three-dimensional data set can be used with third party multivariate analysis software for component analysis, as is done with other analytical techniques such as FTIR, HPLC and MS. There are, in fact, many scientific papers published citing the use of scanning spectrofluorometers for fluorescence EEM component analysis in many disciplines including food sciences, water research and pharmaceuticals.
There are, however, two fundamental limitations of using a traditional scanning PMT fluorometer for EEM component studies. The first is that it takes a very long time to collect a single EEM with a scanning fluorometer. Depending on the brightness of the signal, and the wavelength range and resolution that is required, a single EEM experiment can take a scanning spectrofluorometer up to an hour to collect!

Another important limitation of scanning fluorometers is that the shape of the fluorescence EEM fingerprint itself can change with even subtle variations in sample concentration. If an instrument measures different EEM fingerprints for the same molecule at different concentrations, it really can’t be used for component analysis. For an EEM to be used as a true analytical technique, the shape of the spectra must be independent of concentration.
These two inherent limitations of a scanning spectrofluorometer have impacted the usability of the fluorescence EEM technique, and this has lead to the development by HORIBA of the A-TEEM technique.
HORIBA’s unique A-TEEM technique overcomes these two limitations. With CCD detection technology, HORIBA solves the serious speed limitations of scanning spectrofluorometers because with HORIBA technology, an entire fluorescence EEM can be acquired in mere seconds to minutes depending on the sample.
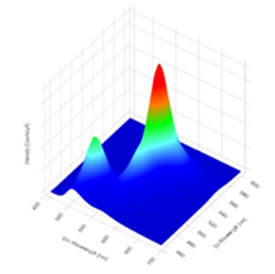
Figure 1. Three dimensional contour plot viewed at an angle of a fluorescence EEM, with three dimensional axis for fluorescence excitation, emission and intensity.
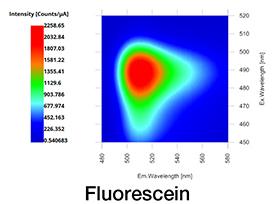
Figure 2. Contour plot (top down view) of fluorescence EEM of fluorescein acquired in one second with Duetta.
HORIBA has also solved the problems associated with the fluorescence inner filter effect by taking advantage of the fact that the A-TEEM technique also collects absorbance of the same sample at the same time as the fluorescence, and uses the absorbance to correct EEMs for the inner filter effect (IFE).
HORIBA calls this technique A-TEEMTM, for Absorbance-Transmission Excitation Emission Matrix. By correcting for inner filter effects, the A-TEEM molecular fingerprint is a much more absolute representation of the true molecular fingerprint. Therefore when using third party multivariate chemometrics analysis software, the A-TEEM data provides much more robust component analysis than can be achieved with just a simple EEM from a scanning fluorometer.
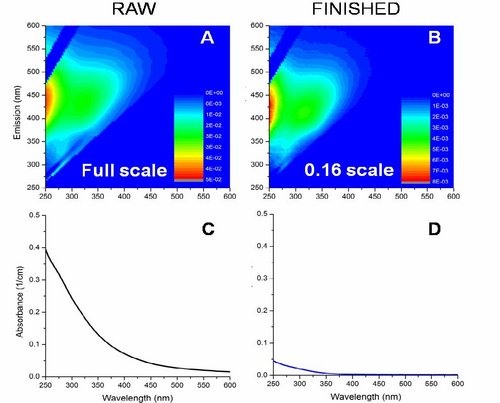
Below is a good example to show how even a small concentration difference in a single molecule can have a significant effect on the shape of an EEM fingerprint, but with proper IFE correction an A-TEEM fingerprint remains the same.
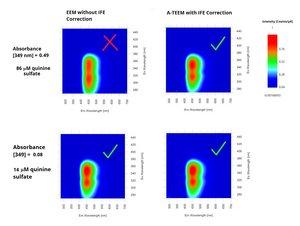
Figure 3. Fluorescence Excitation Emission Matrices of two concentrations of quinine sulfate in tonic water diluted in 0.1 M perchloric acid (aq.) with and without inner-filter effect corrections applied. Acquired with HORIBA Duetta.
Aqualog A-TEEM chemometrics analysis presented here are derived from Eigenvector Research Incorporated, Solo software.

Additional Resources
USGS Procedures for using the Horiba Scientific Aqualog® fluorometer to measure absorbance and fluorescence from dissolved organic matter https://pubs.er.usgs.gov/publication/ofr20181096
Aqualog CDOM Publication Links
Click below to view the Aqualog CDOM publications from the scientfic community. Results may vary depending on which search engine you use.


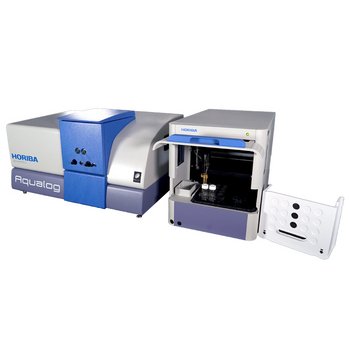
Hardware
- The only true simultaneous absorbance-fluorescence system available
- TE-cooled CCD fluorescence emission detector for rapid data acquisition up to 100 times faster than any other benchtop fluorometer
- Corrected UV-VIS absorbance detection path for stability and accuracy
- Double grating excitation monochromator for superior stray light rejection
- Matching bandpass for absorbance and fluorescence spectra
- Automatic sample changer option (2 or 4 position)
- Compatible with flow cells and titrator
Software
- Optimized experiment set-up menus minimize user configuration time
- Complete NIST-traceable corrected fluorescence spectra automatically generated
- Spectral and kinetic analysis tools for both absorbance and fluorescence data
- Methods and batch protocols for automating multiple sample measurement
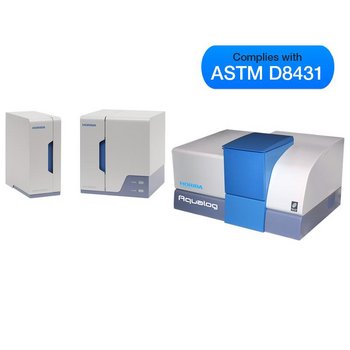
NEW A-TEEM™ technology
A-TEEM technology uses absorbance, transmittance and EEM data to fingerprint molecules with high specificity and ultrahigh-sensitivity at a 6 million nm/min emission scan rate!
All colored molecules exhibit unique molecular absorbance and transmittance spectra; many colored molecules also exhibit unique fluorescence excitation and emission spectra that can be measured as an excitation-emission matrix (EEM). Simultaneously combining Absorbance–Transmission and EEM is a new technique (A-TEEM) that provides a distinct molecular fingerprint with numerous potential applications.
Aqualog combines an ultrafast CCD that’s up to 4,000 times faster than traditional PMT-based fluorometers, with our new A-TEEM technology so you can easily and effectively identify, quantify and understand individual organic compounds in complex mixtures in minutes. A-TEEM has already proven in many cases to be more effective in protein, vaccine, wine and water research, quality and process applications than HPLC and vibrational spectroscopy.
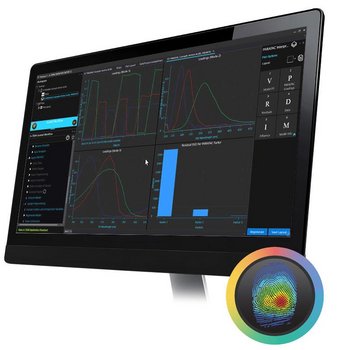
NEW Aqualog® Datastream Dashboard
Features
- Seamless integration with Aqualog
- Convenient HTML-based interface
- Push-button method operation
- Simple administrator level controls for calibration and method development
Benefits
- Easy access through internet or intranet
- Dashboard shows the latest readings, time series and tables for trends and analysis
- WTP can upload their own independent data
Aqualog Datastream Dashboard is powered by Solo_Predictor software from Eigenvector Research, Incorporated
NEW HORIBA Multi-Model Predictor Tool
HORIBA Instruments is pleased to introduce a new software tool designed to automate multivariate and machine learning analysis workflows for industrial QC/QA applications of HORIBA’s patented Aqualog Absorbance- Transmission fluorescence Excitation Emission Matrix (A-TEEM™) spectrometer.
Key Applications of HMMP Tool
- Wine and Grape Quality Chemistry (phenolics, anthocyanins, tannins, sulfites etc..)
- Water Contamination (oil, algae and other materials)
- Grain mold and odor compounds
- Cannabinoids
- Pharmaceuticals (Drugs, Vaccines, Cell Media)
- Olive Oil adulteration and spoilage
- Dietary supplement adulteration
Key Features and Benefits
- Easy, Rapid Operator Level Analysis
- Facilitated Administration of Method Model Development and Editing
- Complete Parameter Profile and Classification Reports
- Compatible with Laboratory Information Management Systems
- HMMP Add-In Fully Integrated into Eigenvector Inc. Solo/Solo+Mia and Exclusively Activated and Supported by HORIBA Instruments Inc.
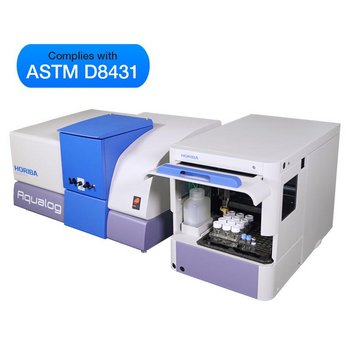
NEW Automatic Sipper Accessory
New for our Aqualog® A-TEEM™ spectrometer, the Aqualog automatic sipper accessory handles sampling from a single source, in addition to dispensing rinsing solutions, detergents and controlling reverse-flow drainage The 4-sample changer unitconnects to the main sipper unit to enable sampling of up to 4 sources.
The sipper offers convenient installation and operation, with built-in automatic cleaning, leak detection and protection. It is fully integrated into the new Aqualog 4.0 software for batch analysis and has a variety of uses in water, pharmaceutical, beverage phenolics and many other applications.
When used at a water treatment plant, the sipper and four channel accessory enable the Aqualog to automatically extract and monitor raw, settled and finished water samples. Each sample changer unit is compatible with overflow and filtration devices, serving up to 4 independent water treatment plant sources.
NEW Fast-01 Autosampler Accessory

The Fast-01 can be configured to use a variety of sample-vials and racks to meet your application needs and enables complete temperature control. Sample vial repeats and injection volumes are easily facilitated with the Aqualog 4.2+ software, which also offers preconfigured blank files.
All data files can be exported with ISO-formatted time-date stamping and user-configurable Sample ID and repeat codes.
All aspects of the Fast-01 hardware control are at your fingertips, with key real-time access features to facilitate the configuration and execution of your batch experiments, as well as priming, cleaning and maintenance.