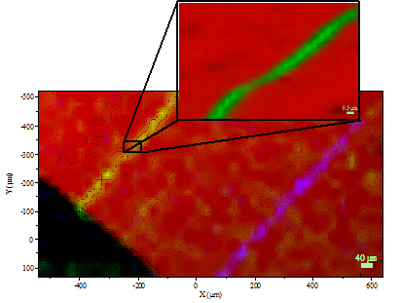

Isolated SWCNTs aligned on a Silicon sample. The colors correspond to the integrated intensity of the Si band (red) and of the respective G bands of the CNTs (green and blue).
DuoScan™ was used in macro-mapping mode to find the isolated CNTs. A high-definition image of the CNT was then obtained with DuoScan™ in step-by-step micro-mapping. The apparent width of the CNT is a convolution of the tube diameter with the laser spot size.
Sample provided courtesy of Dr Kalbac, Heyrovský Institute, Prague, Czech Republic