HORIBA
Search English
Singapore
  • Products
    • Mobility
    • Energy and Environment
    • Industrial Process and Environment
    • Life Science
    • Healthcare
    • Materials
    • Semiconductor
    • Scientific and Analytical Instruments
    • Water & Liquid
    • All products from A to Z
  • Applications
    • Arts, Entertainment and Recreation
      • Art Conservation
      • Museums, Historical Sites and Similar Institutions
    • Biopharma and Pharma
    • Biotechnology and Biomedical
    • Cosmetics
    • Education, R&D and Government Institutions
      • Universities
      • Research and Testing Laboratories
    • Energy Solutions
      • Why HORIBA
      • Hydrogen Energy
        • Global Initiatives
        • Fuel Cell Evaluation
        • FCEV / FCV Evaluation
        • Stationary Fuel Cells
        • Sintering and Reduction Test Station
        • Glow Discharge Optical Emission Spectroscopy: GD-Profiler 2™
        • Evaluation of Hydrogen and Ammonia Engine / Gas Turbine for Power Generation
        • Hydrogen Station Evaluation
        • Water Electrolysis Evaluation
        • Hydrogen Production Evaluation
      • Energy Usage Optimization
        • Energy Management System
        • Environmental Impact Assessment (LCA and GHG Protocol)
        • Battery Manufacturing/Recycling
      • CO2 Capture and Carbon Resource Circulation
        • Reduce
        • Direct Carbon Capture
        • Carbon Resource Circulation
      • Coal and Consumable Fuels
      • Electric Utilities
      • Energy Fuel Oil
      • Environmental Countermeasures
      • Petroleum and Coal Products Manufacturing
        • Petrochemicals
      • Photovoltaics
      • Oil and Gas
      • RoHS and ELV
    • Food and Beverage
    • Healthcare
    • Industrials
      • Battery
      • Commercial and Professional Services
        • Gas mass flow control and measurement for reference value of PM2.5 measurement
      • Construction & Engineering
      • Electrical Equipment
      • Machinery
    • Information Technology
      • Semiconductors
        • 2D Materials
        • Graphene
        • Photovoltaics
        • Display Technologies
        • Data Storage
        • Nanomaterials
      • Semiconductor Manufacturing Process
      • Technology Hardware and Equipment
    • Marine
    • Materials
      • Carbon
      • Polymers and Composites
      • Raw Materials for Semiconductors
      • Metals
      • Minerals
      • Corrosion
      • Ceramics
      • Glass
      • Chemicals
      • Chemical Manufacturing
      • Construction Materials
      • Containers and Packaging
      • Paper, Forest Products and Manufacturing
      • Material Research
      • Photovoltaics
      • Forensic Science
    • Mobility and Transportation
    • Waste Management
      • Solid Waste Management and Remediation Services
      • Water Waste Management and Remediation Services
        • Waste Water and Soil Analysis
        • Waste Water Treatment and Disposal
      • Plastic Waste
    • Water
      • Drinking Water Utilities
      • Water Reuse
        • Water Testing
  • Technology
    • Elemental Analysis
      • Energy Dispersive X-ray Fluorescence (ED-XRF)
        • What is X-ray Fluorescence (XRF)
        • What is X-ray Fluorescence Spectroscopy (micro-XRF)?
        • XRF Key Components
        • XRF Analysis
        • XRF Articles
        • HORIBA XRF Analyzers
      • Glow Discharge Optical Emission Spectroscopy
        • What is Glow Discharge Optical Emission Spectroscopy GDOES?
        • Sample Measurement with GDOES
        • Sample Test and Analysis
        • Comparison with Other Techniques: Surface Analysis
        • Comparison with Other Techniques: Bulk Analysis
        • Instrument Introduction
        • Benefits and Features of Pulsed RF GDOES
        • Join the GD Community
        • Bibliography
      • Inductively Coupled Plasma - Optical Emission Spectroscopy (ICP-OES)
        • Inductively Coupled Plasma - Optical Emission Spectroscopy (ICP-OES)
        • Scientific ICP Spectrometers
        • Applications for ICP-OES
        • ICP-OES and other techniques
        • Principles and Theory
        • Instrumentation
        • Excitation Source
        • Dispersive System
        • Detection Systems Used with ICP-OES
        • Performances in ICP-OES
      • Carbon/Sulfur & Oxygen/Nitrogen/Hydrogen Analysis
    • Health Care
      • Multi Distribution Sampling System (MDSS)
      • Reticulocytes Analysis
      • CBC + CRP
      • Slide Production
      • Automatic Rerun
      • Absorbance
      • Fluorescence
      • Flow cytometry
      • Impedance / Resistivity
      • Sedimentation
      • Spectrophotometry
      • Potentiometry
      • INR screening
      • Clotting
      • Turbidimetric
      • Chromogenic
    • Particle Analysis
      • Dynamic Light Scattering (DLS) Particle Size Distribution Analysis
      • Molecular Weight
      • Nanoparticle Tracking Analysis
      • Static Light Scattering (SLS) / Laser Diffraction Particle Size Distribution Analysis
      • Zeta Potential
      • Centrifugal Sedimentation
    • Fluid Control
      • Vaporization of Critical Process Chemistries
      • Coriolis Flowmetry
      • Thermal Mass Flowmetry
    • Mass Spectrometry
      • Quadrupole Mass Spectrometry
    • Microscopy and Imaging
      • AFM-Raman
        • AFM-Raman
        • What is Tip Enhanced Raman Spectroscopy?
        • What information does TERS provide?
        • How does enhancement of the Raman signal occur in TERS?
        • What are the TERS instrumental configurations?
        • What are the TERS tips materials and morphology?
        • What kind of substrates can be probed with TERS?
        • What is the SPM feedback used for TERS?
        • What is the spatial resolution of TERS?
        • What is the definition of TERS Enhancement factor?
        • What is nonlinear TERS?
        • What are the degradation issues and artifacts in TERS?
        • What are the main TERS applications in Materials Sciences?
        • What are the main Life Sciences TERS applications?
        • References
        • Products
      • Atomic Force Microscopy [AFM]
      • Cathodoluminescence
      • Particle Image Analysis
      • Micro X-ray Fluorescence
      • Raman Microscopy
    • Spectroscopy
      • Cathodoluminescence Spectroscopy
        • Cathodoluminescence Spectroscopy
        • Electron Microscope
        • SEM, ESEM, SEM-FIB, (S)TEM
        • EM Add-on detector
        • SEM-Cathodoluminescence (SEM-CL)
      • AFM-Raman
      • Detectors
        • Introduction to the detectors techniques
        • What is a CCD Detector?
        • What is an EMCCD Detector?
        • Selecting a CCD Camera for Spectroscopic Applications
        • The Relationship Between Wavelength and Pixel Position on an Array
        • Spectroscopy Detector Products
        • Scientific CCD Camera Products
      • 50 years of Diffraction Gratings
      • Diffraction Gratings Ruled and Holographic
      • Fluorescence Spectroscopy
        • Fluorescence Spectroscopy
        • Principles and Theory of Fluorescence Spectroscopy
        • What is the Jablonski Diagram?
        • What is a Fluorescence Measurement?
        • Steady State Fluorescence Techniques
        • What is Fluorescence Anisotropy or Fluorescence Polarization?
        • What are Luminescence Quantum Yields?
        • What is Ratiometric Fluorescence?
        • What is an Excitation Emission Matrix (EEM)?
        • What is A-TEEM spectroscopy?
        • What is Singlet Oxygen?
        • How to Calculate Signal to Noise Ratio
        • Fluorescence Lifetime Techniques
        • Products Using Fluorescence Spectroscopy
      • Quantum Cascade Laser (QCL) Spectroscopy
        • Optical Hardware
        • Concentration Calculation Algorithm
        • Application Fields
      • Raman Imaging and Spectroscopy
        • Raman Spectroscopy
        • History of Raman Spectroscopy
        • Application field
        • Comparison with other techniques
        • Raman analysis
        • Recording spectral images and profiles
        • Description: Combined/hybrid/hyphenated Raman system
        • Confocal Raman microscopy
        • Raman Spectrometer Presentation
        • How the technique is used
        • Raman Image Gallery
        • Related Products
      • Spectrometers and Monochromators
        • Monochromator System Optics
        • Bandpass and Resolution
        • Order, Resolution, and Dispersion
        • Choosing a Monochromator/ Spectrograph
        • Spectrometer Throughput and Etendue
        • Optical Signal to Noise Ratio and Stray Light
        • Entrance Optics
        • Spectrometer, Spectrograph and Monochromator Products
      • Spectroscopic Ellipsometry
        • Spectroscopic Ellipsometry
        • Advantages
        • Instrumentation
        • Measurement Techniques
        • Data Analysis
        • Cauchy dispersion module
        • Products
      • Vacuum Ultra Violet Spectroscopy
        • Vacuum Ultra Violet Spectroscopy
        • VUV technology
        • High Vacuum (HV), Ultra High Vacuum (UHV), gas purge
        • Light sources in VUV
        • VUV system: Detector
        • Aberration
        • References - Articles
      • X-ray Fluorescence
    • Surface Plasmon Resonance
      • Surface Plasmon Resonance imaging
        • Surface Plasmon Resonance Imaging (SPRi)
        • Brief History of the Technique
        • SPR Measurements, Application Field and Comparison with Other Techniques
        • The Basics of Label-free Biomolecular Interactions
        • Instrument Presentation
        • How SPRi is Used
        • Key Accessories. Sensorchips. Surface Chemistry
        • How are the Molecules Immobilized on the biochip?
        • Conclusion & Bibliography
  • Service
    • Analysis Services
      • Analysis Centers and Services
      • EMC Analysis Service
    • Calibration and Certification
    • Customer Support
      • HORIBA Medical Documentation Database
      • Medical Customer Support
      • On-Site Support
      • Software Support
    • Spare Parts and Consumables
    • Testing and Consulting
      • Automotive Testing Centers
    • Training
      • Product Training
        • Scientific Product Training
        • Automotive Product Training
        • Medical Product Training
      • Technology Training
  • Company
    • About HORIBA
      • Home
      • Message
      • Company Profile
      • Corporate Motto and Philosophy
      • Code of Ethics
      • Our Future (Vision, Mission, Values)
      • Corporate Governance
      • Board of Directors
      • Culture
      • History
        • 1945–1960s
        • 1970s
        • 1980s
        • 1990s
        • 2000s
        • 2010s
        • 2020s
      • Group Companies
      • HORIBA Talk
    • Events
    • Career
    • Investor Relations
      • Home
      • Investor Relations News
      • IR Library
        • Financial Statements
        • Presentation Materials
        • HORIBA Report
      • Message from the CEO
      • Mid-Long Term Management Plan
      • Stock Information
      • Shareholders Meeting
      • Other IR Information
        • Investor Relations Calendar
        • Disclaimer
      • Investor Relations Contact
    • News
    • Social Responsibility
      • Sustainability
      • Topics
      • Message
      • Sustainable Management
        • Policy and Promotion System
        • Integrated Management System
        • Health and Productivity
        • UN Global Compact
      • HORIBARIANs
        • HORIBARIANs
        • Human Rights and Labor Management
        • Development of HORIBARIANs
        • Empowerment of Diverse HORIBARIANs
        • Occupational safety and health
      • Environment
        • Environment
        • Environmental Management
        • Climate Action
        • Reduction of Environmental Impact
        • Actions for RoHS Directive, REACH Regulation and GHS Regulations
        • Eco-Friendly Products
      • Social
        • Quality
        • Material Procurement
        • Social Activities
      • Governance
        • Governance
        • Corporate Governance
        • Internal Controls
        • Compliance Promotion Systems
        • Code of Ethics
        • Risk Management
      • HORIBA and the SDGs
      • HR and ESG related Data
      • HORIBA Report
      • GRI Standards Content Index
      • Editing Policy
  • Contact
    • Contact Form
    • Worldwide Locations

Image Analysis of Particles open open
  • Particle Image Analysis
  • Static Image Analysis
  • Dynamic Image Analysis
  • In-Line_On-Line Image Analysis
    HORIBA » Technology » Microscopy and Imaging » Particle Image Analysis 

Back to Particle Characterization Products Overview
Back to Particle Webinar List
Back to Particle Applications

Particle Image Analysis

Particle properties are rarely defined by size alone. To characterize particles more fully, it is often necessary to evaluate size, shape, count, agglomeration state, and contaminants. Particle Image Analysis is one approach that combines imaging with software-based analysis to measure these properties. Depending on the method, image-based analysis can be performed on static images of prepared samples, on particles in motion, or in in-line/on-line systems for real-time process monitoring. These methods help you understand particle populations and support both R&D and quality control.


Key Takeways

1. Particle Image Analysis converts images into particle size and shape distributions. Modern Particle Image Analysis automatically measures particle size and shape from images, and summarizes measurements from large numbers of particles as distributions that describe the sample. 

2. The workflow is consistent across methods. Regardless of the imaging method, Particle Image Analysis typically follows four main steps: image acquisition, image enhancement, particle or phase detection, and measurement. 

3. The best approach depends on how images are acquired—and whether correlative chemical information is needed. With visible-light imaging, Particle Image Analysis is commonly categorized as Static, Dynamic, or In-Line/On-Line Image Analysis, primarily reflecting differences in image acquisition. 

   - If you need correlative chemical or elemental identification of the same particle,
      Static Image Analysis offers a unique advantage. 

   - If you need high-throughput statistics, Dynamic Image Analysis is often preferred. 

   - If you need real-time monitoring, In-Line/On-Line Image Analysis enables
     continuous data acquisition. 


Table of Contents
  • What is Particle Image Analysis?

          - Typical Workflow for Particle Image Analysis
          - Imaging Methods and Measurable Size Range
          - Size / Shape Parameters
 

  • Types of Particle Image Analysis

           - Comparison: Static vs Dynamic vs In-Line/On-Line
           - How to Choose (Quick Decision Guide)

  • FAQ
  • Browse Products


­


What is Particle Image Analysis?

Particle Image Analysis extracts physical properties of particles, such as particle size and shape, from images. Because a typical particle sample contains many particles of different sizes and shapes, modern analysis is typically performed automatically with software. Measurements from many particles are then summarized as distributions that describe the sample.

Typical Workflow for Particle Image Analysis

There are four main steps in Particle Image Analysis: image acquisition, image enhancement, object/phase detection, and measurement.

Typical work flow for Particle Image Analysis
  1. Image Acquisition: The process begins by capturing an image of the sample. Modern analyzers use bright, uniform lighting to ensure high-quality image capture. 
     
  2. Image Enhancement: The acquired image is processed to improve contrast, sharpness, and background uniformity. This step helps make the subsequent particle or phase detection easier and more accurate. 
     
  3. Object/Phase Detection: A single image typically contains multiple objects, whose regions can be separated from the background based on brightness differences. Depending on the optical system, objects may appear bright (white) or dark (black). The object and phase regions in the image are then identified and segmented. While well-dispersed objects are easy to detect, touching or overlapping objects may require more advanced algorithms that consider shape and brightness.
     
  4.  Measurement: Based on the detected outlines, the final step is to quantitatively measure particle size, shape, and other properties. The resulting measurements can then be summarized as distributions that describe the sample.
Particle Size Accuracy and Minimum Detectable Diameter

Detected particles are represented as groups of pixels. Therefore, particle-size accuracy is determined by the pixel size, that is, the actual length represented by one pixel. In contrast, the minimum detectable particle diameter depends on both the pixel size and the optical system. For example, if a particle image is captured with an optical system that has a 5 µm resolution and a pixel size of 100 nm, the particle size can be measured with an accuracy of approximately 100 nm, while the minimum detectable particle diameter is approximately 5 µm.

Size/Shape parameters

Particle size or shape parameters can be calculated from the image information obtained through particle detection. Common parameters include:


- Equivalent Circle Diameter: The diameter of a circle having the same area as the particle.

- Aspect Ratio: The ratio of the width to the length of the minimum-area rotated rectangle that circumscribes the particle. For a perfect circle, the value is 1.

- Circularity: A parameter calculated so that the value becomes 1 for a perfect circle. It is typically based on the ratio of area to perimeter.


- Feret Diameter (Feret max, also called caliper diameter): The maximum distance between two parallel lines touching the particle outline.


The particle size distribution determined by general image analysis methods is typically presented as a histogram, with particle size or another per-particle parameter on the horizontal axis, and the number of particles on the vertical axis.


Types of Particle Image Analysis

Within optical microscopy, Particle Image Analysis can be divided into Static Image Analysis, Dynamic Image Analysis, and In-Line/On-Line Image Analysis. These methods differ mainly in how the sample is presented during image acquisition, which in turn affects throughput, particle tracking, and the type of analysis that can be performed.

- Static Image Analysis: Particles are measured from a stationary sample, typically on a prepared slide. This approach is useful when detailed analysis of individual particles is needed, and it can also support correlative analysis with other techniques.

- Dynamic Image Analysis: Particles are measured as they pass through the field of view. This approach is often preferred when high-throughput statistics are required.

- In-Line/On-Line Image analysis: ​​​​​​Measurements are performed directly in the process, either through a window or via a bypass line. This approach is well-suited for real-time monitoring and continuous data acquisition. 

Please refer to the respective pages for more details.

Comparison: Static vs. Dynamic vs In-Line/On-Line


1. Key Characteristics of Each Method

Comparison Item

Static Image Analysis

Dynamic Image Analysis

In-Line/On-Line Image Analysis

Sample StateStationary 
Dispersed and fixed
Flowing 
In air or liquid

Flowing
Within the process, or automatically conditioned in a bypass line.

Measurement Speed/ThroughputSlow
Analyzes particles within a limited field of view; takes time to achieve statistical reliability.
Fast
Can measure tens of thousands, to millions of particles in a short time.
Fast/Continuous
Enables real-time, continuous data acquisition.
 
Sample PreparationTime-consuming
Particles must be uniformly dispersed on a surface without overlapping. Results are highly dependent on operator skill.
Relatively Easy 
Utilizes dry (air) or wet (solvent) dispersion units. The system automates flow and dispersion, minimizing the need for operator skill.
Minimal to None
Direct in-line measurement requires no preparation. Alternatively, an automated bypass system (on-line setup) can be installed to extract and dilute the sample to optimal conditions.
 
Image Quality/ResolutionVery High
Allows for precise focusing, making it ideal for evaluating minute surface structures and exact shapes.
High to Medium
Requires short exposure times to prevent motion blur. Image quality may be slightly lower than static analysis.
Environment-dependent
Susceptible to process conditions. Using a bypass line with automated dilution can improve image clarity.
 
Integration with Chemical/Elemental AnalysisEasy
Enables multi-modal analysis of the same particles using hybrid systems or cross-platform tracking. 
Difficult
Technologically challenging to acquire chemical signals for individual, fast-moving particles.
Difficult
Technologically challenging to acquire chemical signals for individual, fast-moving particles.

2. Key Advantages and Typical Applications

Comparison Item

Static Image Analysis

Dynamic Image Analysis

In-Line/On-Line Image Analysis

Key Advantages
  • Extremely high-resolution shape data.
  • Measurable even with trace amounts of sample. 
  • High statistical reliability in a short time.
  • Easy to automate operations.
  • Eliminates sampling effort.
  • No operator-induced variations.
Main Applications
  • Research & Development (R&D).
  • Foreign particle analysis and detailed defect analysis.
  • Evaluation of trace samples.  
  • Quality Control (QC).
  • Routine inspection of powders, granules, and slurries.
  • Alternative or supplement to laser diffraction methods.
  • Real-time monitoring of granulation, crystallization, and milling processes.
  • Feedback for automated control of manufacturing lines.


How to Choose (Quick Selection Guide)

Use Static Image Analysis if you need the highest image quality and detailed shape evaluation. Because particles are stationary, you can precisely focus and capture extremely high-resolution shape data, making it well-suited for R&D, foreign particle investigations, and detailed defect analysis, such as correlative chemical/elemental identification on the same particle. Stationary particles on a slide or filter can be targeted with probes such as lasers or X-rays for molecular structure and elemental analysis on the exact same particles.

Choose Dynamic Image Analysis when you need fast, statistically reliable results. Particles flow through the field of view, enabling measurement of tens of thousands, to millions, of particles in a short time—ideal for routine inspection and quality control where throughput matters.

Select In-Line/On-Line Analysis for real-time, continuous process monitoring. When you want continuous data acquisition directly from the process (or via an automated bypass line), In-line/On-line setups minimize sampling effort and support feedback for automated control of manufacturing lines.


FAQ

The required number of particles depends on the width of the particle size distribution and the desired confidence level. For powders with a uniform, narrow particle size distribution, a small amount of data is sufficient. However, to obtain reliable data for materials with a wide distribution, information on a large number of particles is necessary. Specific numerical values ​​are provided in ISO 13322. As a rule of thumb, Dynamic Image Analysis can reach statistical reliability quickly because it can measure tens of thousands to millions of particles in a short time, while Static Image Analysis may take longer due to a limited field of view.

Static Image Analysis is best when you need very high-resolution shape data and may want to combine morphology with chemical/elemental analysis on the same stationary particles. Dynamic Image Analysis is best for fast, high-statistics measurements, and In-line/On-line Analysis is best for real-time, continuous monitoring in a process.

Preparation depends on the method: Static Image Analysis is typically time-consuming because particles must be uniformly dispersed without overlapping, while Dynamic Image Analysis often uses dry/wet dispersion units with automated flow/dispersion. In-line/On-line Analysis can require minimal preparation for direct in-line measurement, or use an automated bypass line to condition the sample.

Particle shape parameters (such as aspect ratio, circularity, and sphericity) significantly affect the physical properties and performance of materials. For example, even if powders have the same particle size, those with a higher degree of circularity have the characteristic of having higher fluidity as a powder. Image analysis enables accurate measurement of these parameters, supporting quality control and process optimization.

Common parameters include equivalent circle diameter, maximum Feret diameter, aspect ratio, and circularity. These are used for physical characterization and process control.Common parameters include equivalent circle diameter, maximum Feret diameter, aspect ratio, and circularity. These are used for physical characterization and process control.

Image analysis measures individual particle size and shape directly, while laser diffraction estimates particle size distribution based on light scattering. Each method has advantages depending on the application. When comparing, it is important to pay attention to the particle size basis (whether it is based on number or volume).

Browse Products

Partica
Partica

Laser Diffraction and Dynamic Imaging Particle Size and Shape Analyzer
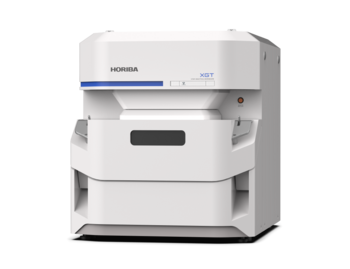
XGT-9000
XGT-9000

X-ray Analytical Microscope (Micro-XRF)
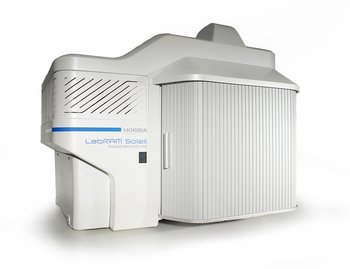
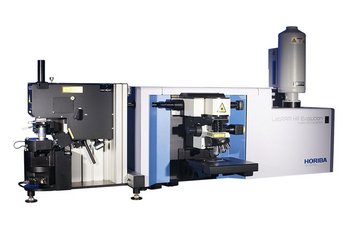
LabRAM Soleil
LabRAM Soleil

Raman Spectroscope - Automated Imaging Microscope
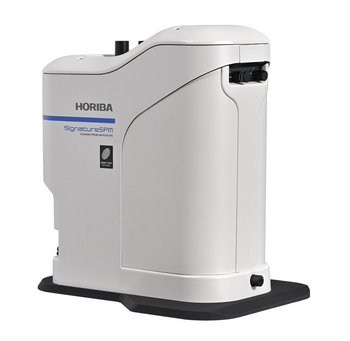
AFM Optical Platform
SignatureSPM
SignatureSPM

Scanning Probe Microscope with Chemical Signature
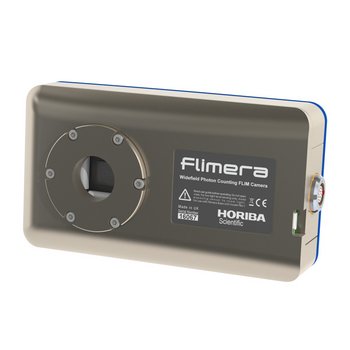
FLIMera
FLIMera

SPAD array imaging camera for dynamic FLIM studies at real time video rates
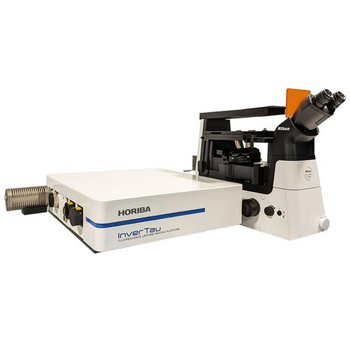
InverTau
InverTau

Fluorescence Lifetime Imaging Platform
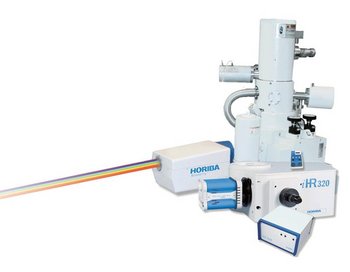
Cathodoluminescence - CLUE Series

Cathodoluminescence Solutions for Electron Microscopy
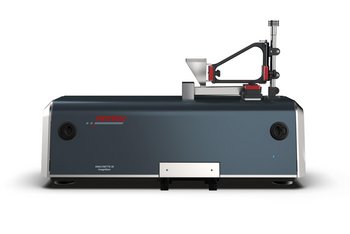
ANALYSETTE 28 ImageSizer*

Dynamic Image Analysis

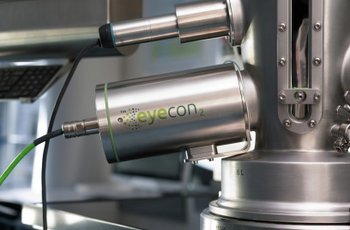
Eyecon2™*
Eyecon2™*

Direct Imaging Particle Analyzer

Request for Information

Do you have any questions or requests? Use this form to contact our specialists.

* These fields are mandatory.

  • Products
    • All Products (A-Z)
    • Mobility
    • Energy and Environment
    • Life Science
    • Healthcare
    • Materials
    • Semiconductor
  • Applications
    • Drinking Water Utilities
    • Automotive Manufacturing
    • Semiconductor Manufacturing Process
    • Research and Testing Laboratories
  • Technology
    • Glow Discharge Spectroscopy
    • Pressure-based Flowmetry
    • Quadrupole Mass Spectrometry
    • Raman Spectroscopy
  • Service
    • On-Site Support
    • Spare Parts and Consumables
  • Company
    • News
    • Events
    • Career
    • History
    • Corporate Culture
  • Contact
    • Career Contact
    • Contact Form
    • Worldwide Locations
    • Investor Relations Contact

Terms and Conditions Privacy Notice Cookies HORIBA Group Social Media