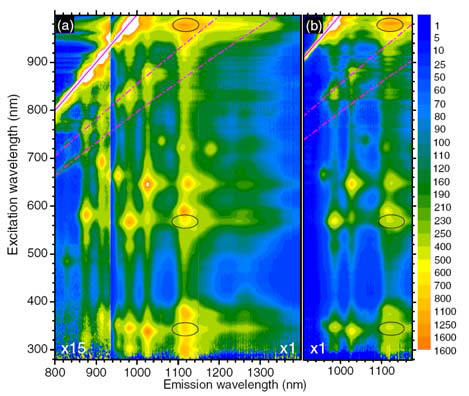
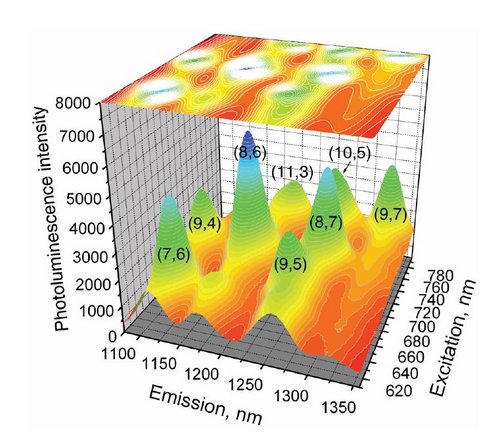
Photoluminescence of SWNTs


For Instant Water Quality Reports
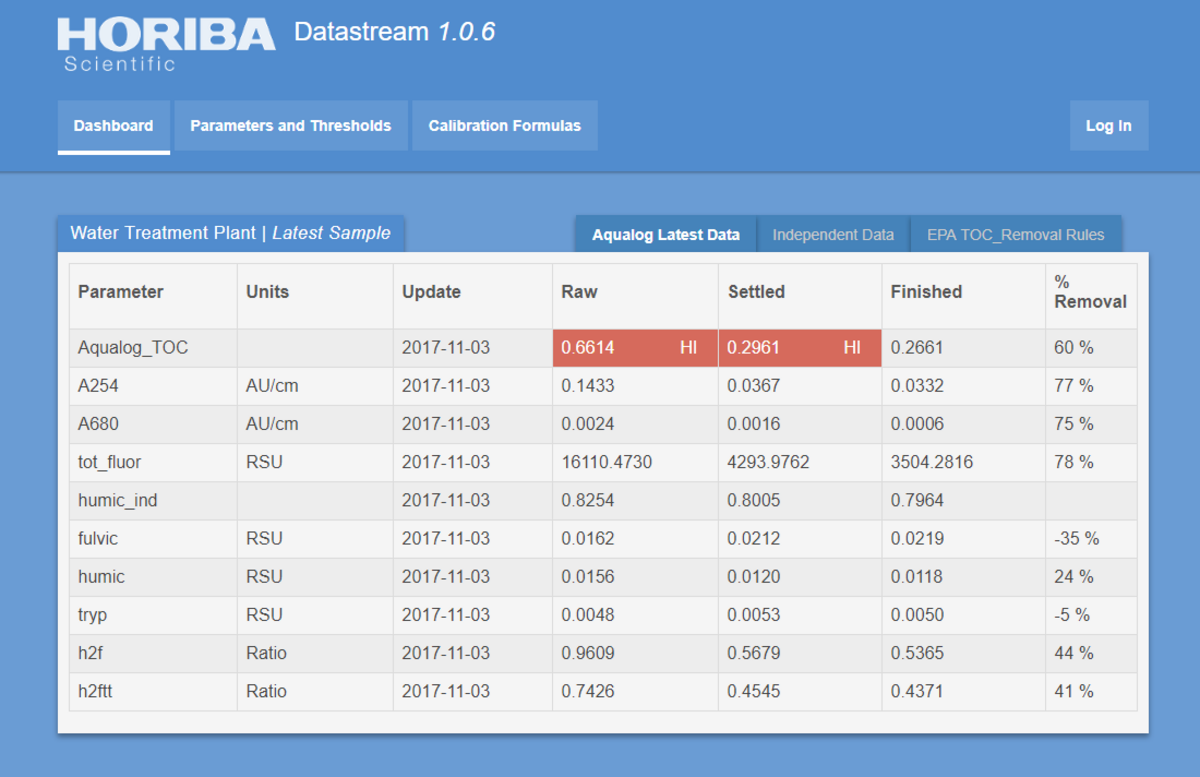
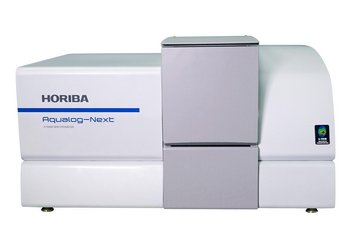
The NEW Aqualog® Datastream Dashboard facilitates completely automated analysis and reporting of a wide range of organic matter parameters that are critical for managing and optimizing the drinking water treatment process. The Datastream parameters have been selected to specifically target disinfection by-product issues, algal issues and other contamination components. The Dashboard provides the latest readings, time series and tables or trend analysis, % removals, thresholds and MCLs (Maximum Contaminant Limits) for all of these parameters, and reports on fit statistics and residual evaluation for system performance monitoring, contamination detection and early warning alerts.
The Datastream Dashboard is the latest enhancement to the HORIBA Aqualog. The Aqualog is the only instrument with patented simultaneous UV-Vis and fluorescence ExcitationEmission Matrices (EEMs), which are acquired up to 100 times faster than with other instruments.
Water treatment facilities can also upload their independent data to simultaneously analyze pH, alkalinity, turbidity, Cl2 and other key parameters.
Aqualog Datastream Dashboard is powered by Solo_Predictor software from Eigenvector Research, Incorporated

| Aqualog Datastream Parameters | Specifications | Notes |
|---|---|---|
| Dissolved Organic Carbon Concentration (DOC) | 30 µg/l-20 mg/l | Requires Filtration (0.45 µm) |
| A254 nm | 1 cm path length | |
| SUVA | L DOC mg-1 A254 m-1 | |
| Simulated Distribution, System Trihalomethane, Formation Potential | SDS THMFP (10 µg/l – 500 µg/l) | MCL USEPA = 80 µg/l |
| Parallel Factor Analysis Component Scores | Up to 7 | Can include Algal, Oil/PAH, Tracer Dyes and other Components |
| Residuals (Q) | Detect Contaminants and Measurement Issues | |
| % Variance Accounted For | Detect Contaminants and Measurement Issues | |
| Absorbance Spectrum | 200-800 nm; 1 cm path length | Any wavelength coordinate or ratio can be analyzed with extinction coefficients |
| Excitation Emission Matrix (EEM) Regions | I-V plus Algal (Bluegreen/Brown/Green) | Custom EEM regions also available; Based on Interpolated EEM Processing |
| Total Fluorescence | Sum of EEM Regions I-V | |
| Humic Index | ||
| Fluorescence Index | ||
Independent Treatment Plant Data | ||
| DOC | mg/l | |
| Alkalinity | mg/l | |
| Chlorine Residual | mg/l | |
| THM/SDSTHMFP | µg/l | |
| A254 nm | Adjustable Path Length Specifications | |
| pH | ||
| Additional Parameters Available | ||
| System Requirements | Datastream Specifications | |
|---|---|---|
| Windows OS | 64 bit Windows 7 or higher | |
| Web Browser | Google Chrome ≥V53.x or Firefox ≥49.x | |
| Memory (RAM) | ≥ 4 GB | |
| Hard Disk | ≥ 4 GB | |
| DVD-ROM | Required | |
| USB Ports | ≥ 2 | Additional ports may be required for accessories |
| Video Resolution | ≥ 1024 x 768 | |
| Eigenvector Solo Industrial | V8.2 or higher | |
| HORIBA Onsite Installation/Calibration | Required | |
| HORIBA 6 month service | Advised | |
| License Period | 1 year renewable | |
| Aqualog Hardware | UV-800 (200-800 nm) |
 Aqualog Datastream Dashboard is powered by Solo Predictor software from
Eigenvector Research, Incorporated
Do you have any questions or requests? Use this form to contact our specialists.

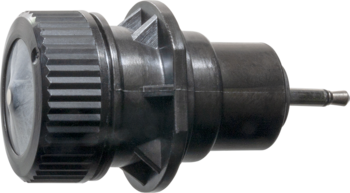
ISFET pH Electrode
")
Submersible Type
")
Submersible Type
")
Submersible Type
")
Flow Type
")
For Very Slender Test Tubes
")
For Food Samples
")
For Flat Surface Measurement
")
For High Accuracy pH Measurement
")
Submersible Type)
")
For General Laboratory Application
")
For Low-Volume Samples
")
For General Purpose Use
")
For Large Containers and Long Test Tubes
")
For Viscous and Non-Aqueous Samples
")
Electrode for Low-Volume Samples
")
For General Purpose Use
")
For Hydrofluoric Acid or HF Samples
For Strong Alkali Samples
")
For Large Containers and Long Tubes
")
For Viscous and Non-Aqueous Samples
3 pcs/pack
Adjustable Type

Field-installation type water quality measuring instruments

Field-installation Type Fluoride Ion Concentration Meter
Field-installation type ammonia nitrogen meter
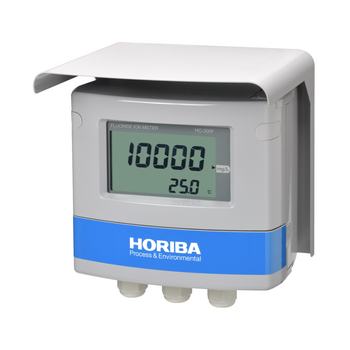
Field-installation Type Fluoride Ion Concentration Meter

ICP Software

For your specific application

Highly sensitive silica monitor for ultrapure water management in semiconductor/FPD processes
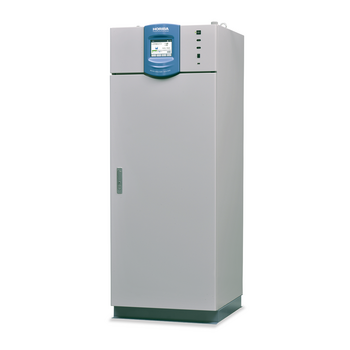
Silica analyzer

Affordable high performance ICP-OES
Unlock Unprecedented Insights into Water Quality and Environmental Health
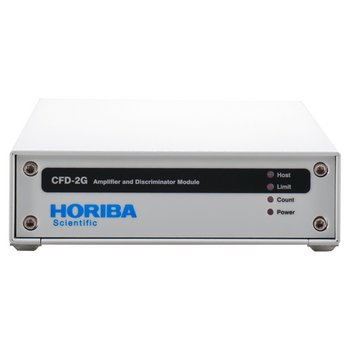
Amplifier-Discriminator
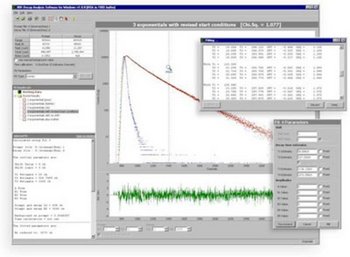
Decay Analysis Software
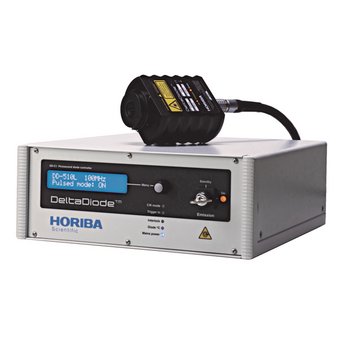
TCSPC Pulsed Sources
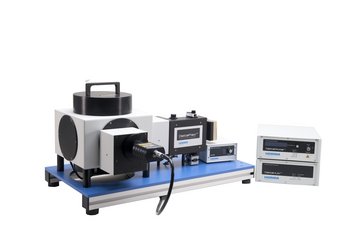
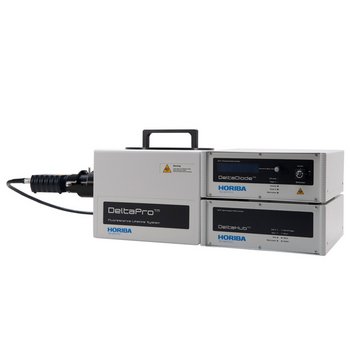
TCSPC/MCS Fluorescence Lifetime System
TCSPC Lifetime Fluorometer
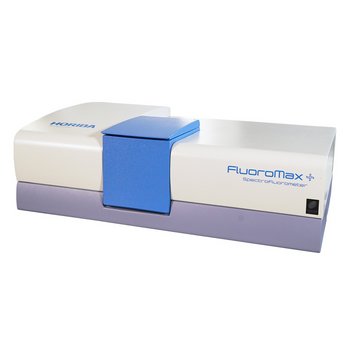
Full Spectra in Milliseconds for Industry and Academia

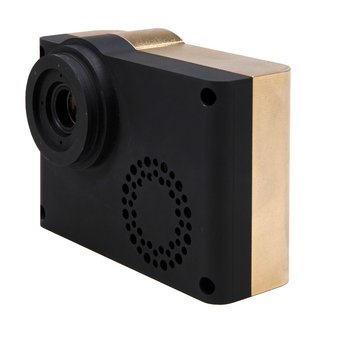
SPAD array imaging camera for dynamic FLIM studies at real time video rates
Modular Research Fluorometer for Lifetime and Steady State Measurements
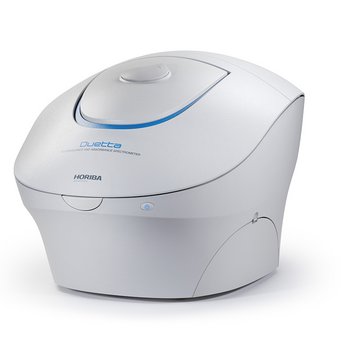
Steady State and Lifetime Benchtop Spectrofluorometer
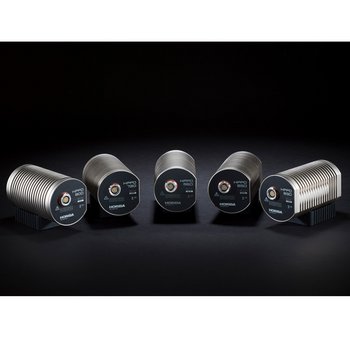
HORIBA’s latest development in TCSPC detector technology
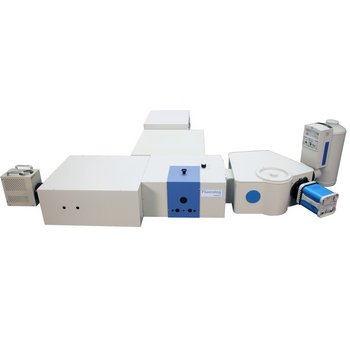
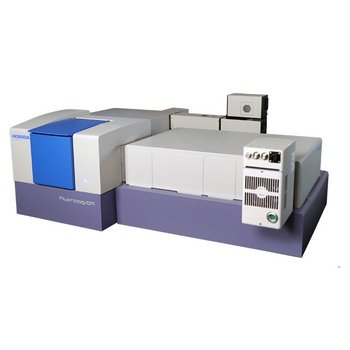
Steady State and Lifetime Nanotechnology EEM Spectrofluorometer

For Single‐Walled Carbon Nanotube Excitation‐Emission Map Simulation and Analysis
Single photons detection with picosecond accuracy
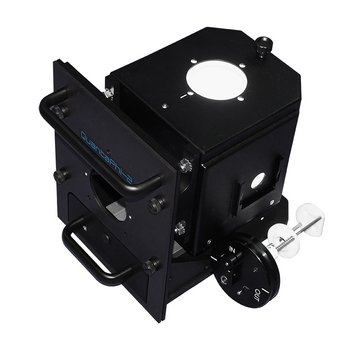
PLQY Integrating Sphere
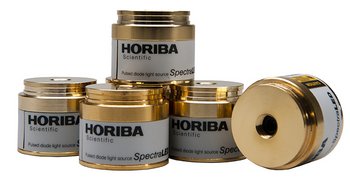
LED Phosphorescence Light Sources
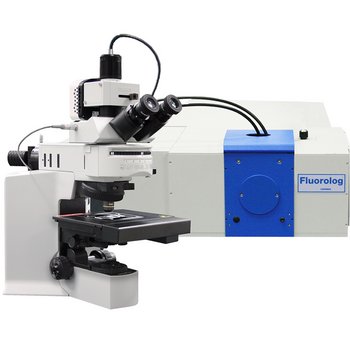
Connect any of our steady state and hybrid fluorometers to virtually any upright or inverted microscope!


")

 5002S-10C")


 6583S-10C")


 6560S-10C")


 6561S-10C")