Vidéo de présentation (en anglais)
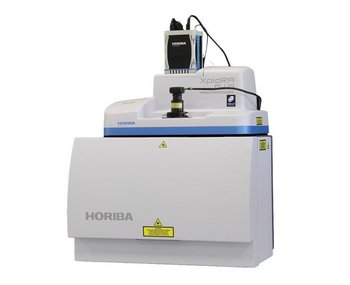
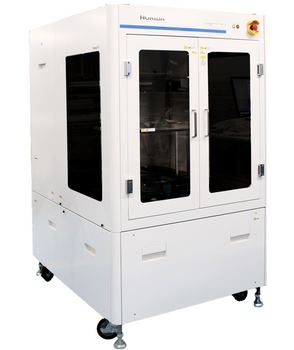
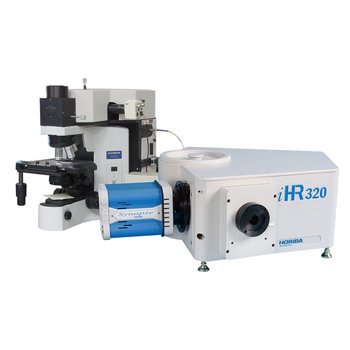
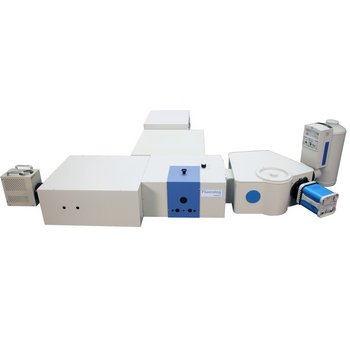
Imagerie confocale multimodale dans un format compact
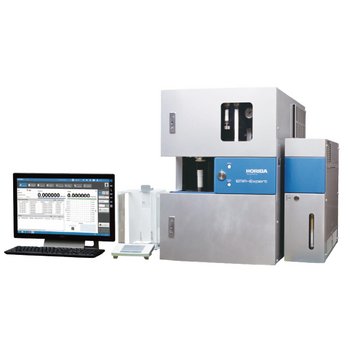
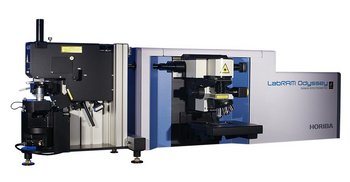
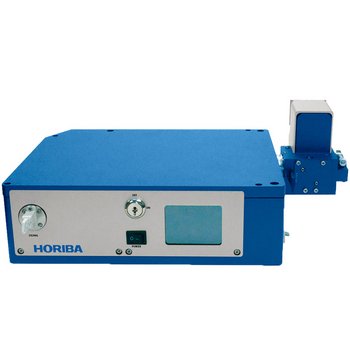
Le LabRAM Soleil™ offre une grande variété de modes de visualisation optique et de fonctions d'imagerie hyperspectrale dans un design compact, avec un laser qui ne présente aucun danger :
- Encombrement au sol < 1 m²
- Compartiment à échantillon de grande dimension de Classe 1
- Illumination par réflexion (épiscopique) / transmission (diascopique)
- Imagerie en microscopie optique en champ clair/champ sombre
- Topographie 3D ViewSharp
- Technologie de balayage de haute qualité Qscan™ pour l'imagerie confocale 3D avec illumination par nappe de lumière laser, cartographie sans déplacement
- Imagerie confocale 3D XYZ, profil Z (point unique ou couche par couche avec l'option QScan™)
- Diffusion Raman à très basse fréquence (30 cm-1) de série
- Photoluminescence (PL), électroluminescence, photocourant
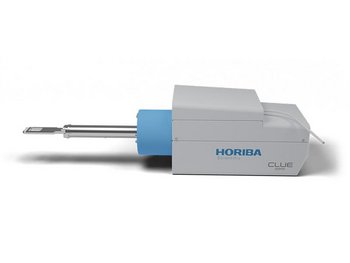
- Spectroscopie à l'échelle nanométrique : nanoRaman (TERS), NanoPL et Cathodoluminescence avec nos extensions AFM et SEM
Concentrez-vous sur votre travail, il s'occupe du reste !
Oubliez la préparation chronophage et fastidieuse nécessaire à l'obtention d'une image Raman. Le LabRAM Soleil™ offre des fonctions automatisées avancées qui, combinées à l'assistant EasyImage™, réduisent considérablement le temps de paramétrage et assurent une stabilité et une reproductibilité maximales :
- Système véritablement autonome
- Assistant EasyImage™
- Alignement automatique : contrôle et réajustement automatiques de l'alignement en quelques secondes en fonction des conditions environnementales
- SmartID™ : plus de risque d'utiliser un objectif ou des paramètres inappropriés
- Maintenance à distance
Imagerie ultrarapide : l'imagerie Raman n'a jamais été aussi rapide !
Grâce à une stabilité optomécanique supérieure et à une technologie avancée de calibration vidéo Raman brevetée, le LabRAM Soleil™ permet d'obtenir une imagerie Raman de haute qualité jusqu'à 100 fois plus rapidement qu'un spectromètre Raman classique.
- SmartSampling™ : le nouvel algorithme de cartographie permet d'acquérir les points les plus pertinents en premier et de procéder à la cartographie en quelques minutes, contre plusieurs heures auparavant.
- TurboDrive™ : tourelle à réseaux rapide (jusqu'à 400 nm/s)
- 4 fonctions SWIFT™ :
- SWIFT™
- SWIFT™ XS : Mode Ultra – imagerie Raman rapide : jusqu'à 1 400 spectres/s, mode Haut contraste : mesure rapide et signal amélioré
- SWIFT™ XR : acquisition rapide de larges gammes spectrales grâce au mode Multi-fenêtre
- Repetitive SWIFT™ : amélioration continue du rapport signal/bruit au fil du temps
Relever tous les défis analytiques :
Étude de matériaux ou de polymères, laboratoires biologiques ou pharmaceutiques : le LabRAM Soleil™ s'adapte facilement à chaque application. Sa modularité et sa flexibilité avancées en font le système de microscopie Raman idéal pour les laboratoires de recherche universitaires ou les services industriels de contrôle qualité.
- Jusqu'à 4 lasers internes et 6 filtres différents
- Tourelle 4 réseaux interchangeable en moins d'une minute
- Très basse fréquence de série : jusqu'à 30 cm-1 de décalage Raman
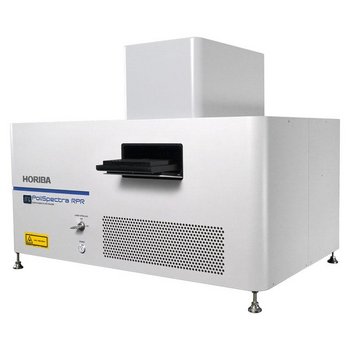
- Grand compartiment à échantillon : 444 x 509 x 337 mm (H x L x l)
- Grande robustesse et maintenance simplifiée
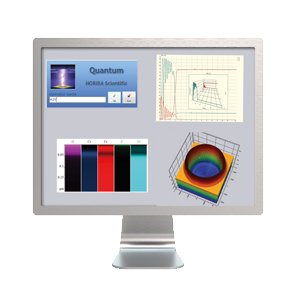
Logiciel LabSpec 6 : exploitez facilement toute la puissance du LabRAM Soleil™ !
Le logiciel LabSpec 6 offre une grande modularité grâce aux applications LabStore exclusives. Chaque utilisateur peut configurer le logiciel en fonction de ses besoins. Efficacité et performance se conjuguent avec facilité d'utilisation. Grâce à la conception moderne et intuitive du logiciel, il n'a jamais été aussi simple d'obtenir une image Raman parfaite. Plus besoin d'être un expert.
- Analyse multivariée avancée MVAPlus™ : traitez facilement des ensembles de données mégapixels avec une précision maximale pour l'identification et la quantification de molécules, même sur des échantillons « complexes ».
- ProtectionPlus est conforme aux exigences de la partie 11 du titre 21 du code des règlements fédéraux de la FDA (21 CFR Part 11), ainsi qu'aux exigences relatives aux bonnes pratiques de fabrication (BPF) et aux bonnes pratiques de laboratoire (BPL)
- ParticuleFinder™ combine automatiquement l'analyse morphologique et chimique pour classer les particules en quelques secondes
- Flux de travail automatisé avec EasyImage™ pour obtenir une image Raman en un seul clic


.")


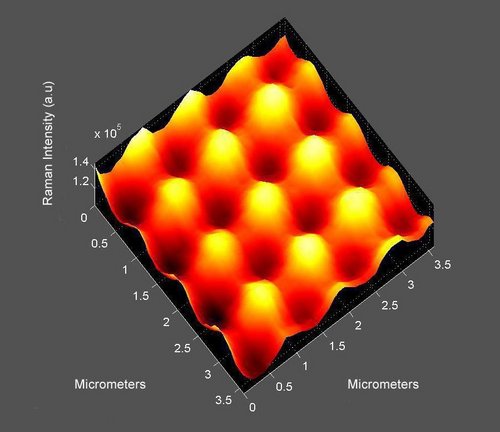


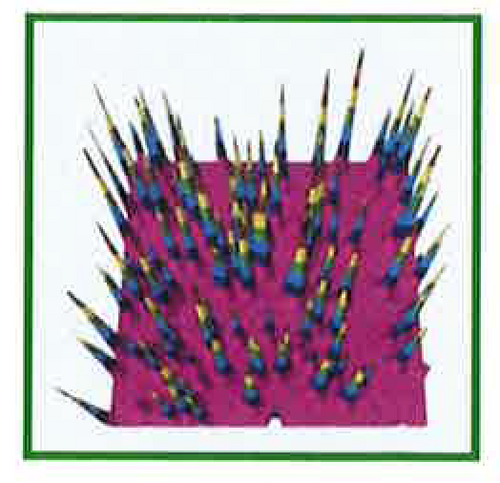


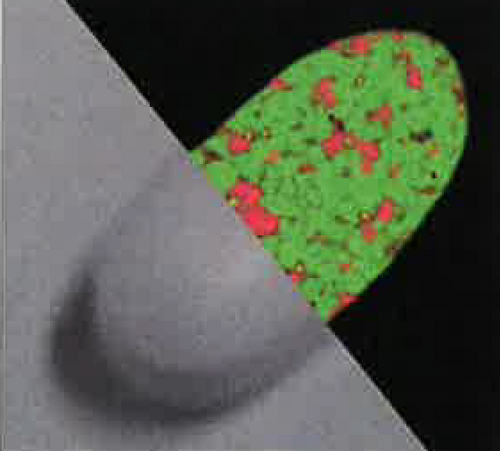
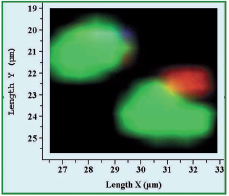
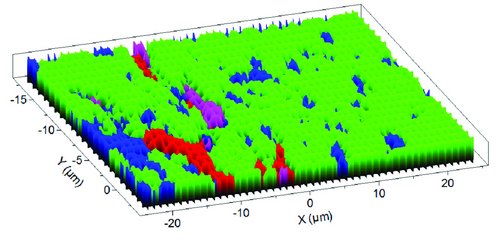
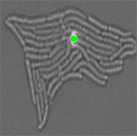
 Raman map of MoS2 layers.")