Battery materials characterization

Discover how complementary analytical techniques reveal the structure, composition and uniformity of battery materials, from carbon powders to electrode coatings.
How can crystallinity and layers in battery materials be characterized?
Raman spectroscopy provides information about structural order, chemical composition and spatial distribution. Glow discharge optical emission spectrometry (GD-OES) reveals how elemental composition changes beneath the surface. Atomic force microscopy coupled with Raman spectroscopy (AFM-Raman) connects chemical information with surface topography and local mechanical properties. Together, these techniques support the characterization of battery materials and components.
Language: English | Duration: Approximately 24 minutes
Series: HORIBA Solutions for the Full Battery Value Chain
How does GD-OES analyze electrode layers?
GD-OES progressively removes material to reveal elemental distributions through electrode layers. It supports comparisons of charge states and layer consistency, with suitable calibration required for quantitative analysis.
What does Raman spectroscopy reveal about crystallinity?
Raman D and G bands help assess structural order and disorder in carbon materials, while mapping reveals sample variability. Interpretation depends on the material and measurement conditions.
How does Raman characterize carbon nanotubes and silicon–carbon composites?
Raman provides insights into nanotube structure and diameter under suitable conditions. In silicon–carbon composites, it distinguishes amorphous and crystalline silicon contributions and characterizes the carbon component.
How does Raman mapping evaluate electrode processing?
Raman mapping reveals component distributions, uneven mixing and localized accumulation, helping assess how processing affects electrode homogeneity.
What does AFM-Raman add?
AFM-Raman correlates surface topography and local mechanical properties with chemical composition, supporting a more complete characterization of battery components such as separators.
Raman spectroscopy provides molecular and structural information, including spatial maps. GD-OES provides elemental profiles through a material as it is progressively sputtered. The techniques answer complementary questions.
Raman spectroscopy assesses structural order and disorder through spectral features such as the D and G bands. Quantitative interpretation depends on the material and measurement model; a band ratio alone is not a universal crystallinity measurement.
GD-OES can detect lithium and investigate how its signal changes through an electrode. Quantitative concentration profiles require appropriate calibration and control of sample-dependent effects.
Yes, with suitable preparation and transfer arrangements. The webinar discusses glovebox preparation and protected transfer to limit exposure before analysis.
AFM provides surface and mechanical information, while Raman identifies chemical and structural characteristics. Their correlation helps connect local physical properties with material composition.
Patrick Chapon is GD-OES Product Manager and Senior Expert at HORIBA France, with extensive experience in elemental depth profiling and surface analysis. He has contributed to more than 80 scientific publications and 17 patents related to glow discharge technology. In this webinar, he explains how GD-OES helps characterize elemental distributions and layers in battery electrodes.
Read more about Patrick Chapon 〉
Alice Fiocco is a Product Application Specialist at HORIBA France, specialized in AFM, AFM-Raman and nanoscale characterization. She holds a PhD in physical chemistry from Sorbonne University and works on materials for energy applications, including batteries and fuel cells. In this webinar, she explores how Raman spectroscopy and AFM-Raman reveal the structure, composition and homogeneity of battery materials.
Raman spectroscopy: for battery material characterization
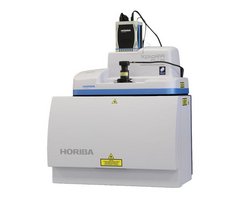
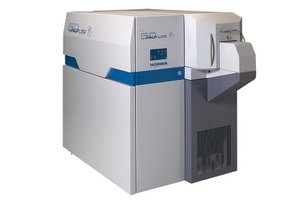
GD-OES: for elemental depth profiling.
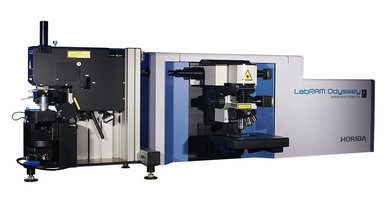
AFM-Raman: for correlated surface and chemical analysis
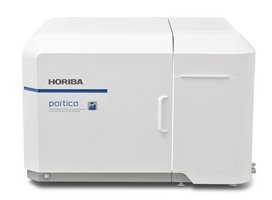
Particle size analysis: for complementary processing studies.
Do you have any questions or requests? Use this form to contact our specialists.