Dieses Produkt wurde eingestellt und ist nicht mehr verfügbar. Zu Informationszwecken kann diese Seite weiterhin aufgerufen werden.

Quality control of hand sanitizer gels and 70% alcohol products using Raman spectroscopy

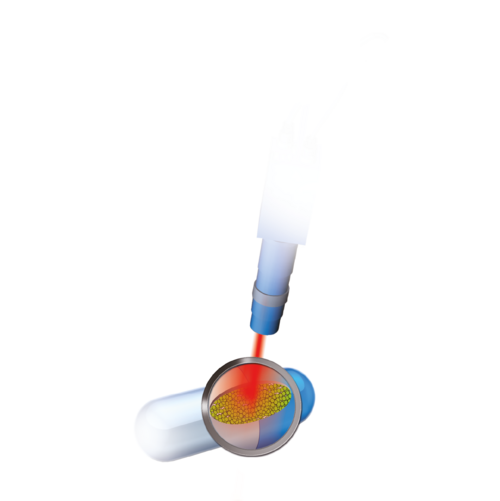
Disinfecting your hands with hydroalcoholic gel has become a daily practice. In the meanwhile, 70° alcohol has been used for even longer to disinfect wounds. But, to remain efficient, the alcohol concentration of these products must not be below a defined threshold and must be controlled. This application note demonstrates how to evaluate alcohol concentrations in a quality control process with Raman.


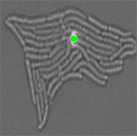


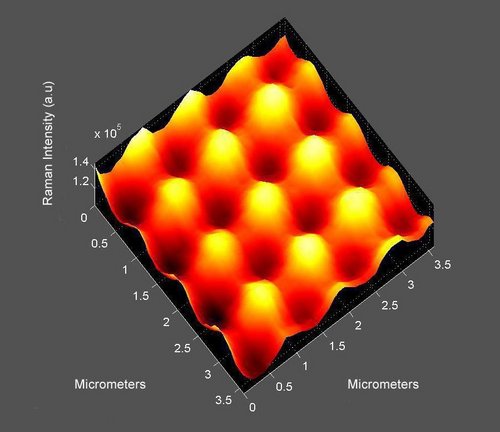
 Raman map of MoS2 layers.")


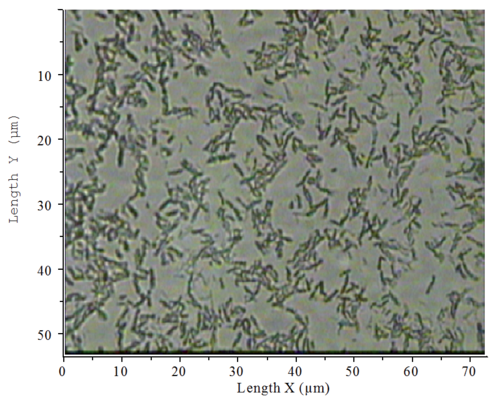
.")