O plástico é um tipo de material resistente à degradação e praticamente indestrutível. Embora o plástico se decomponha em fragmentos, que por sua vez se transformam em microplásticos (1 µm a 5 mm*) e nanoplásticos por meio de mecanismos foto-oxidativos, o plástico permanece fundamentalmente o mesmo durante todo o processo. As nanopartículas podem ser inaladas, ingeridas ou expostas à pele e apresentam maior absorção celular do que partículas maiores. Consequentemente, as nanopartículas têm um impacto maior na saúde. A preocupação com a contaminação da água por nanoplásticos (≤ 1 µm) é, portanto, um tema de estudo que vem sendo acompanhado de perto pela FDA e pela EPA.
* Nomenclatura baseada no tamanho, conforme a Seção 116376 do Código de Saúde e Segurança do Estado da Califórnia.
Um dos métodos comprovados para lidar com aplicações de microplásticos é o uso da espectroscopia Raman. A espectroscopia Raman permite a identificação química de partículas orgânicas e inorgânicas, fornecendo pistas sobre a origem do plástico. Quando a espectroscopia Raman é combinada com ParticleFinder, a subamostragem de microplásticos por tamanho e forma de partícula pode ser automatizada diretamente no software. HORIBA Scientific oferece uma solução para microplásticos; clique para ler sobre os últimos desenvolvimentos e colaborações acadêmicas em Análise de Microplásticos.
Partículas menores que 1 µm, no entanto, são trabalhosas e difíceis de quantificar usando espectroscopia ou outras técnicas tradicionais. Em uma publicação recente, Yang et al. utilizaram a técnica de Análise de Rastreamento de Nanopartículas Multiespectral (mNTA) ViewSizer 3000 para estudar o transporte de microplásticos do oceano para a atmosfera por meio da aerossolização de spray marinho. O experimento explorou a capacidade da mNTA de contar partículas com precisão em uma matriz ambiental complexa e, ao fazê-lo, refutou a crença popular de que o oceano contribui com a maior parte do plástico presente no ar.
Artigo publicado: Limitar o fluxo de emissão de partículas de microplástico do oceano | Environmental Science & Technology Letters (acs.org)
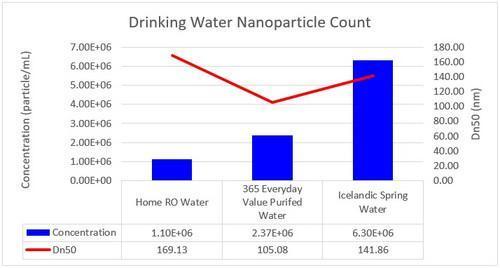
Embora a contagem exclusiva de nanopartículas de plástico entre todos os outros materiais presentes na água ainda seja uma aplicação em desenvolvimento que envolve um procedimento adequado de coloração de partículas, apresentamos aqui exemplos de contagens de nanopartículas em três fontes de água potável:
- Água filtrada por osmose reversa doméstica (onde a água é forçada através de membranas para remover impurezas) coletada em um frasco de vidro.
- Água purificada 365 Everyday Value (garrafa de plástico)
- Água mineral glacial islandesa (garrafa de plástico)
O fluxo de trabalho da análise é simples. 500 µL de água foram transferidos diretamente da fonte para a célula de medição. Três lasers operando simultaneamente (635 nm, 520 nm, 445 nm) foram então usados para coletar e rastrear partículas até que um número estatisticamente significativo de partículas fosse coletado em 50 vídeos ou aproximadamente 30 minutos. As análises abaixo são resultados médios de triplicatas. Demonstrou-se que, embora a água engarrafada seja comercializada como mais limpa e superior, os dados mostram o contrário. A água de osmose reversa doméstica apresenta a menor contagem de nanopartículas em geral, em comparação com a água filtrada de forma semelhante da marca 365 Everyday Value. A água mineral islandesa contém o maior número de partículas por mL.