Size:
3.48
MB
LabSpec6 option for Photocurrent Mapping Brochure
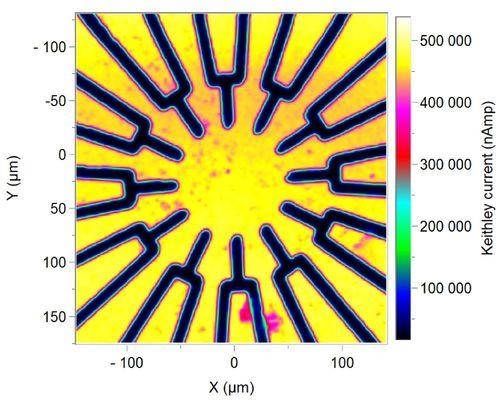
HORIBA Scientific developed an interface which allows LabSpec6 spectroscopy software to read data from a SMU2450 and automatically display photocurrent or photovoltage maps within its graphical user interface, and easily compare it with Raman or Photoluminescence maps.
In addition, using the Keithley interface, one can also generate easily global or spatially and spectrally resolved electroluminescence (EL) maps for further characterization.
Check out our LabSpec 6 Video Resource Center to fully master your LabSpec 6 spectroscopy software!
|  |
 | Nanomaterials
| |
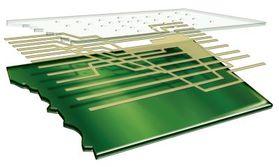
Semiconductor Structures
|  | |
 | Organic Materials
| |
Energy and Lighting
|  | |
 | Discrete and Passive Components
|
Você tem alguma dúvida ou solicitação? Utilize este formulário para entrar em contato com nossos especialistas.

Customize your instrument

Intuitive Auto-Soft Interface for the Auto SE and Smart SE
Hybrid Chemical and Video Image Display
A Platform for HORIBA Scientific Ellipsometers
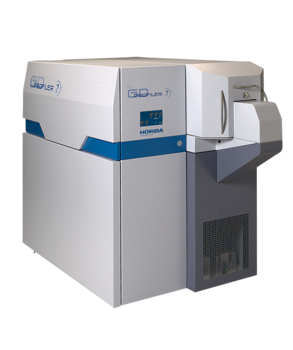
Discover a Whole New World of Information with Glow Discharge Optical Emission Spectrometer
Emphasize Raman and Optical Images
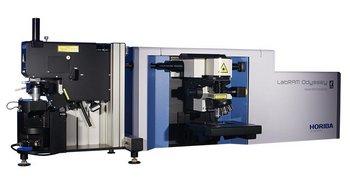
AFM-Raman for physical and chemical imaging

Raman Spectroscope - Automated Imaging Microscope

Real-time and Direct Correlative Nanoscopy
LabSpec 6 is a validated software
Recall settings, and automate processes
Data analysis for complex data sets
Fast and easy Raman acquisition

Manual label-free molecular interaction analysis machine Flexible Research Platform
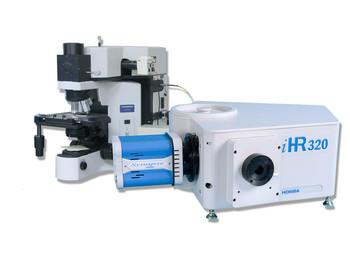
Fiber coupled microscope
Customize with VBS
Password protected user access control
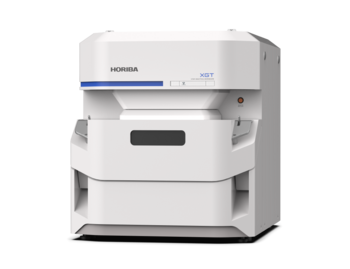
X-ray Analytical Microscope (Micro-XRF)

X-ray Analytical Microscope
with a Super Large Chamber

AFM-Raman for Physical and Chemical imaging
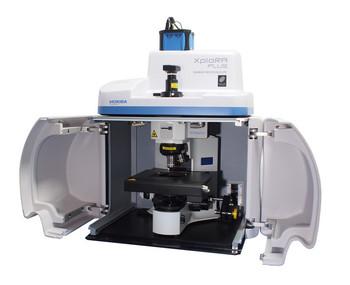
MicroRaman Spectrometer - Confocal Raman Microscope
