Featured Videos
Aqualog Water Treatment Plant Analyzer Video | 
Webinar: Integrated Characterization of Organic Matter for Water Treatment Optimization | 
A-TEEM™ Molecular Fingerprinting Video |
Aqualog Data Stream and Sipper Video | 
Spectroscopy in :60 - FAST -01 Autosampler | 
EEM Acquisition Speed Comparison Video |

Life in the Arctic with the Aqualog | Life in the Arctic with the Aqualog was created entirely by our customer who wanted to record her experience transitioning from a scanning fluorometer to the Aqualog for water research. She is solely responsible for its content. | |
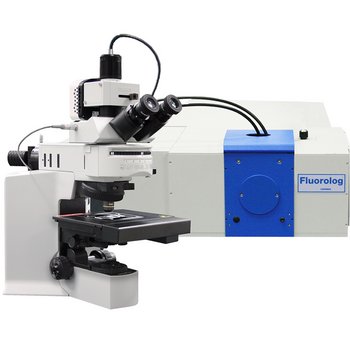
Hardware
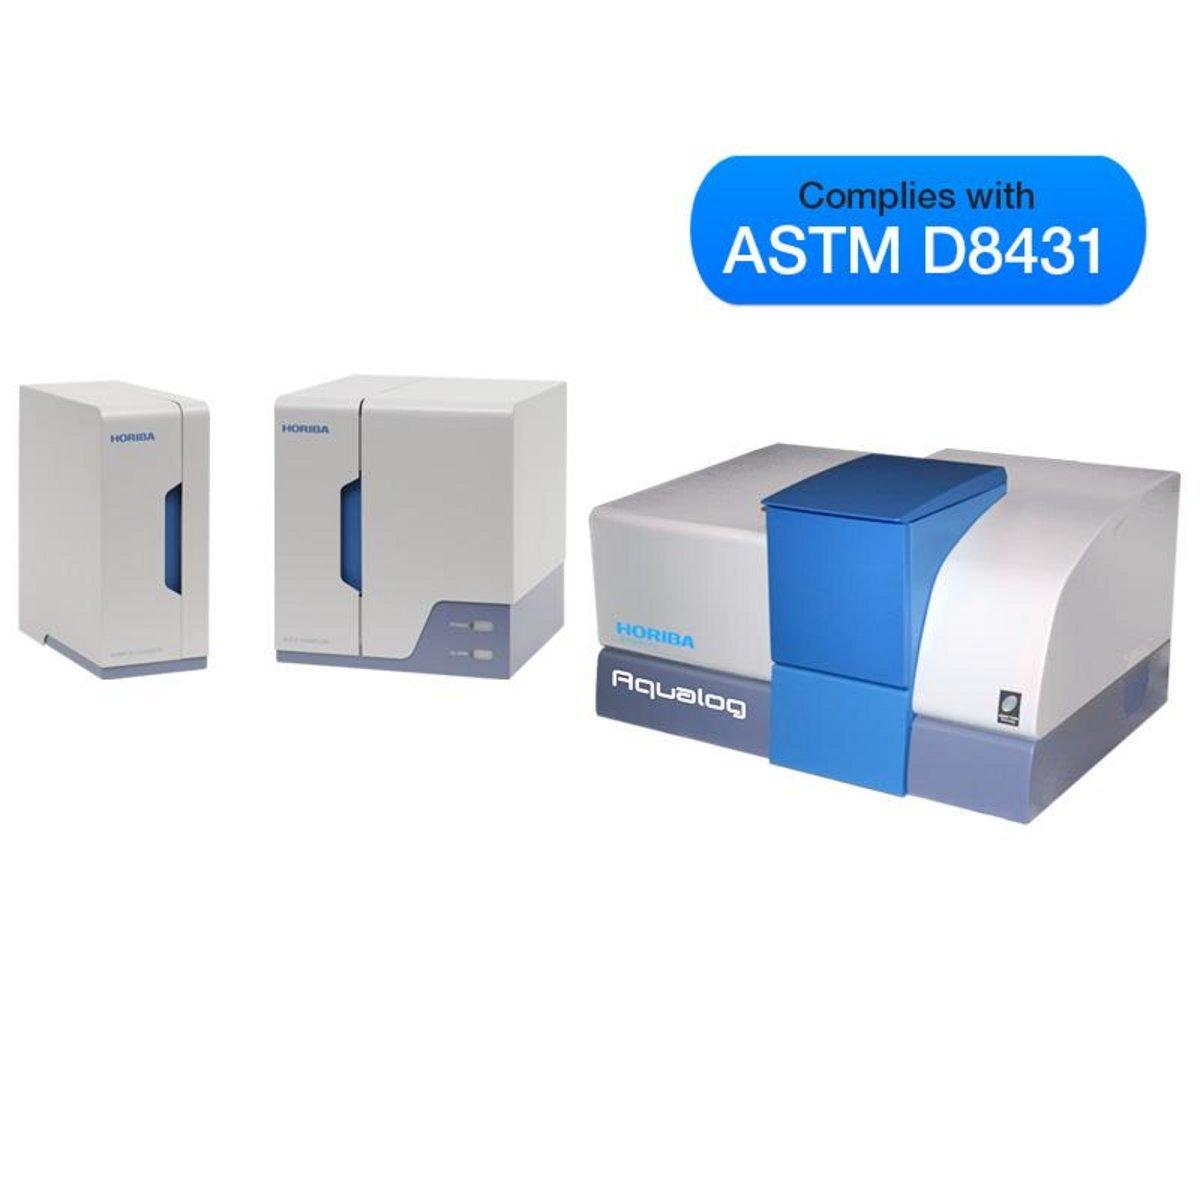
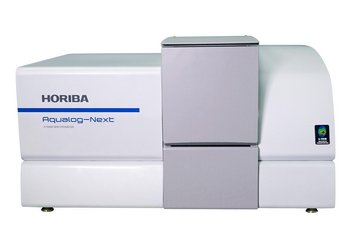
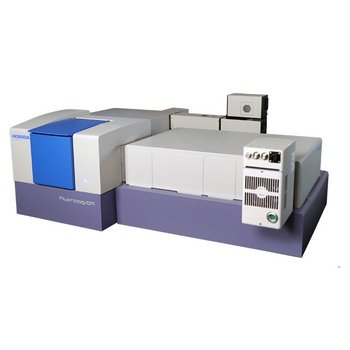
- The only true simultaneous absorbance-fluorescence system available
- TE-cooled CCD fluorescence emission detector for rapid data acquisition up to 100 times faster than any other benchtop fluorometer
- Corrected UV-VIS absorbance detection path for stability and accuracy
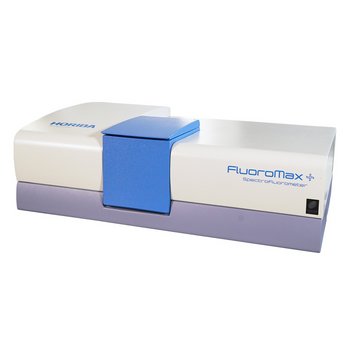
- Double grating excitation monochromator for superior stray light rejection
- Matching bandpass for absorbance and fluorescence spectra
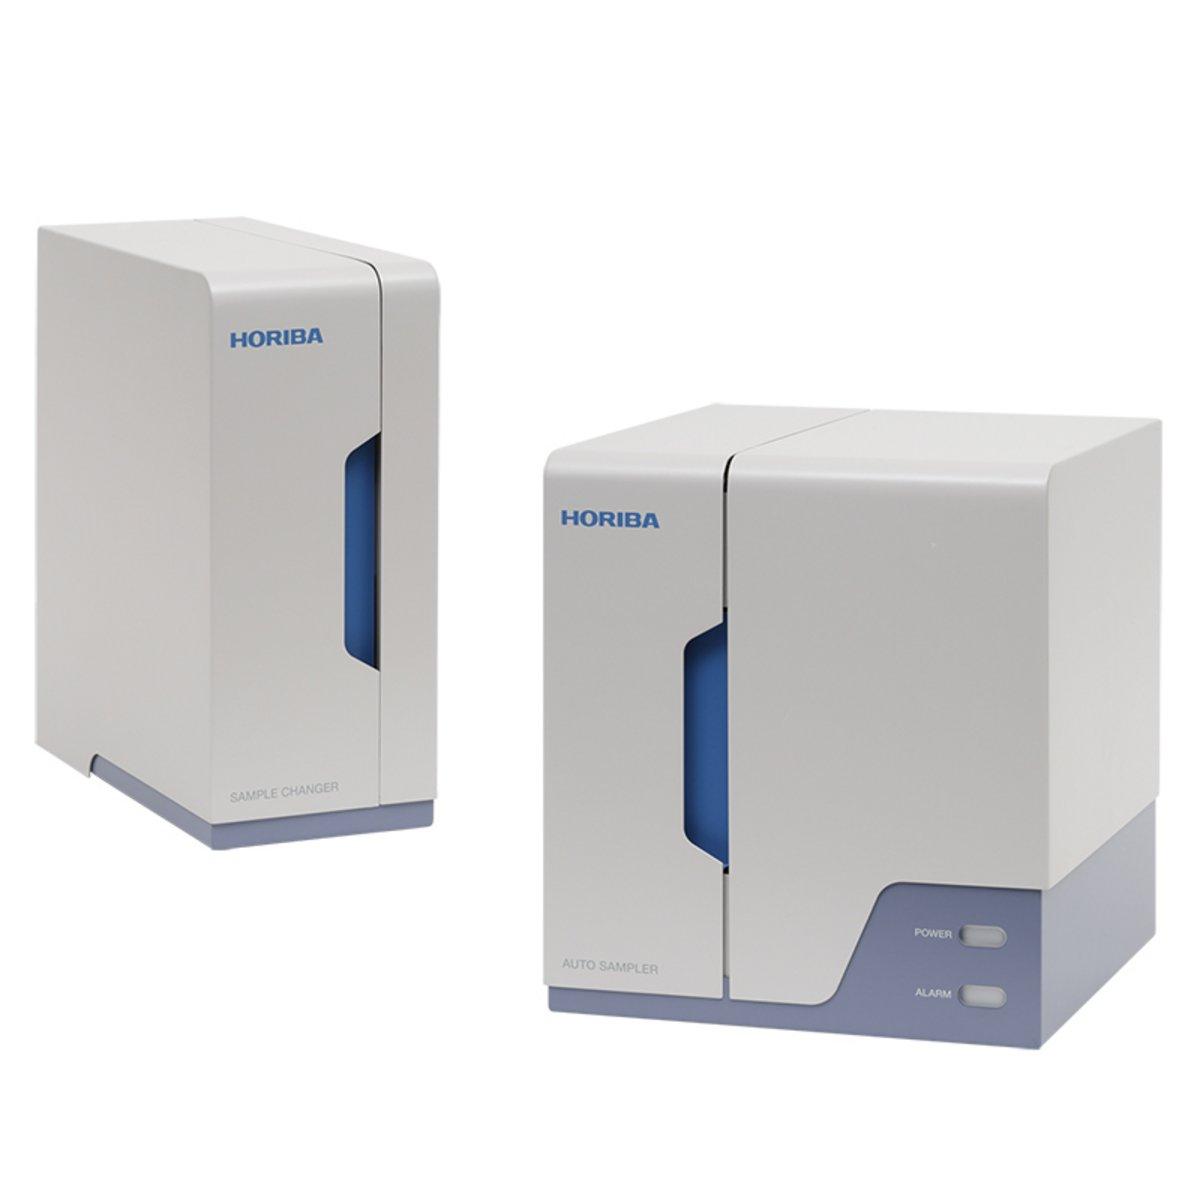
- Automatic sample changer option (2 or 4 position)
- Compatible with flow cells and titrator
Software
- Optimized experiment set-up menus minimize user configuration time
- Complete NIST-traceable corrected fluorescence spectra automatically generated
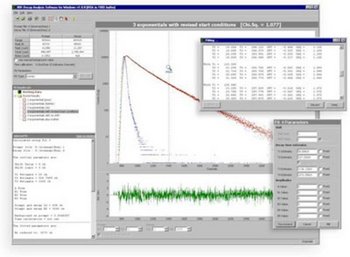
- Spectral and kinetic analysis tools for both absorbance and fluorescence data
- Methods and batch protocols for automating multiple sample measurement
NEW A-TEEM™ technology
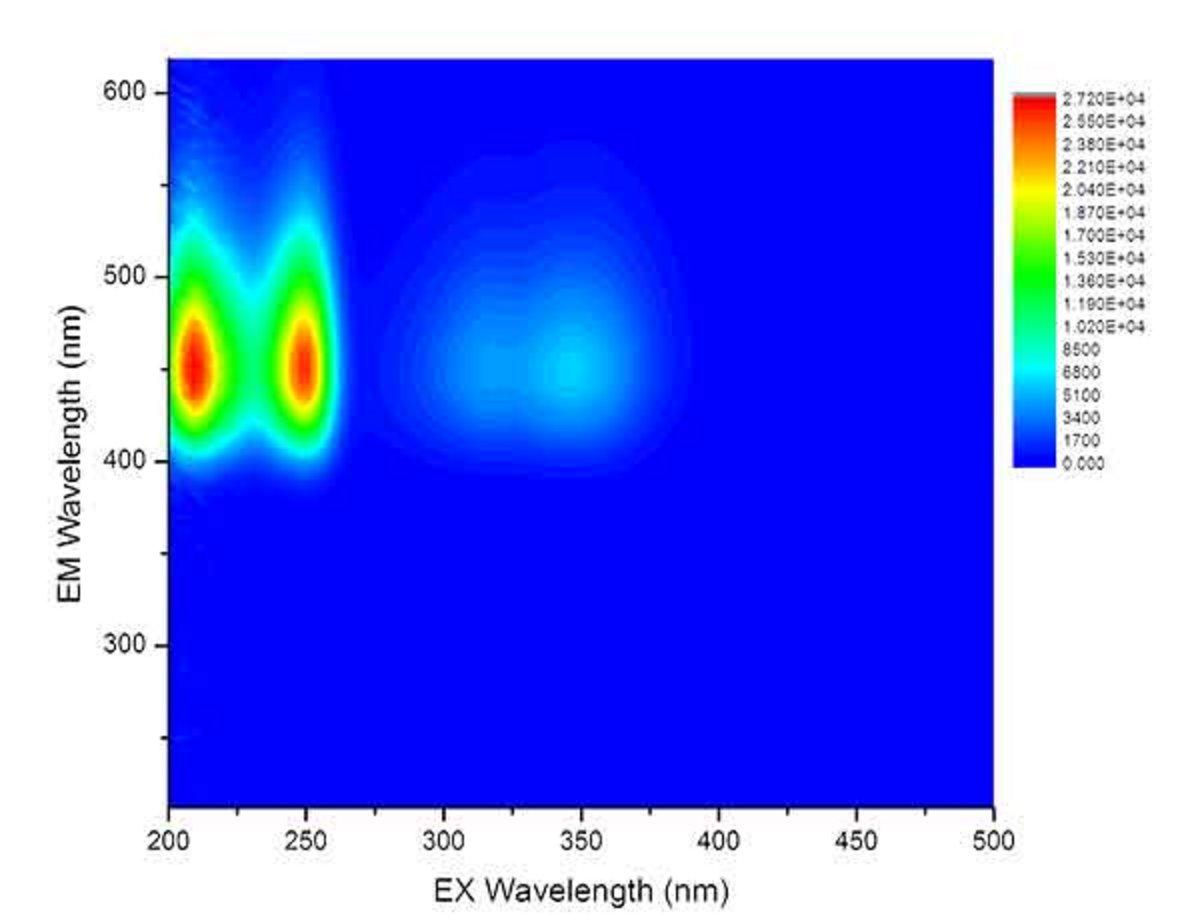
A-TEEM technology uses absorbance, transmittance and EEM data to fingerprint molecules with high specificity and ultrahigh-sensitivity at a 6 million nm/min emission scan rate!
All colored molecules exhibit unique molecular absorbance and transmittance spectra; many colored molecules also exhibit unique fluorescence excitation and emission spectra that can be measured as an excitation-emission matrix (EEM). Simultaneously combining Absorbance–Transmission and EEM is a new technique (A-TEEM) that provides a distinct molecular fingerprint with numerous potential applications.
Aqualog combines an ultrafast CCD that’s up to 4,000 times faster than traditional PMT-based fluorometers, with our new A-TEEM technology so you can easily and effectively identify, quantify and understand individual organic compounds in complex mixtures in minutes. A-TEEM has already proven in many cases to be more effective in protein, vaccine, wine and water research, quality and process applications than HPLC and vibrational spectroscopy.
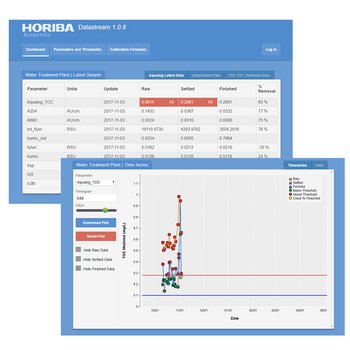
NEW Aqualog® Datastream Dashboard
Features
- Seamless integration with Aqualog
- Convenient HTML-based interface
- Push-button method operation
- Simple administrator level controls for calibration and method development
Benefits
- Easy access through internet or intranet
- Dashboard shows the latest readings, time series and tables for trends and analysis
- WTP can upload their own independent data

Aqualog Datastream Dashboard is powered by Solo_Predictor software from Eigenvector Research, Incorporated
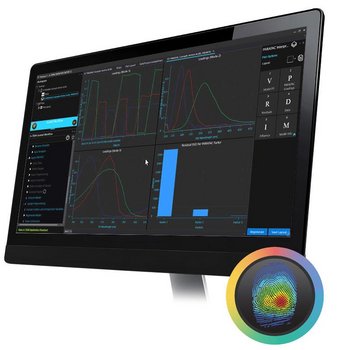
NEW HORIBA Multi-Model Predictor Tool
HORIBA Instruments is pleased to introduce a new software tool designed to automate multivariate and machine learning analysis workflows for industrial QC/QA applications of HORIBA’s patented Aqualog Absorbance- Transmission fluorescence Excitation Emission Matrix (A-TEEM™) spectrometer.
Key Applications of HMMP Tool
- Wine and Grape Quality Chemistry (phenolics, anthocyanins, tannins, sulfites etc..)
- Water Contamination (oil, algae and other materials)
- Grain mold and odor compounds
- Cannabinoids
- Pharmaceuticals (Drugs, Vaccines, Cell Media)
- Olive Oil adulteration and spoilage
- Dietary supplement adulteration
Key Features and Benefits
- Easy, Rapid Operator Level Analysis
- Facilitated Administration of Method Model Development and Editing
- Complete Parameter Profile and Classification Reports
- Compatible with Laboratory Information Management Systems
- HMMP Add-In Fully Integrated into Eigenvector Inc. Solo/Solo+Mia and Exclusively Activated and Supported by HORIBA Instruments Inc.
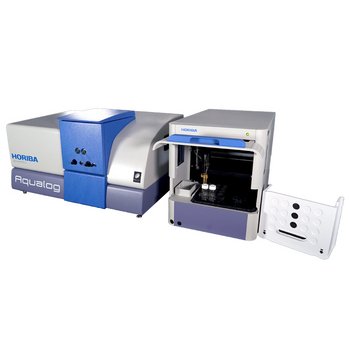
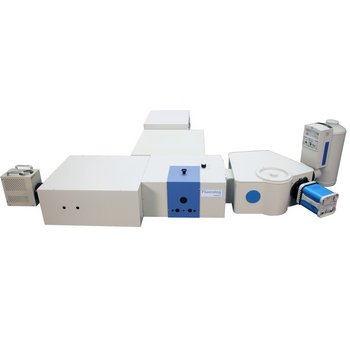
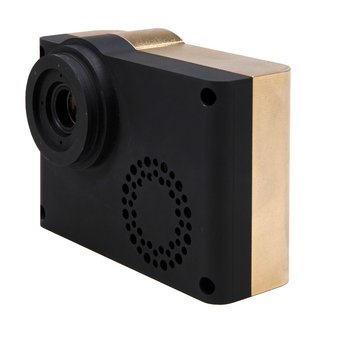
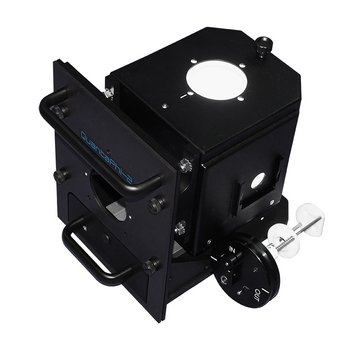
NEW Automatic Sipper Accessory
New for our Aqualog® A-TEEM™ spectrometer, the Aqualog automatic sipper accessory handles sampling from a single source, in addition to dispensing rinsing solutions, detergents and controlling reverse-flow drainage The 4-sample changer unitconnects to the main sipper unit to enable sampling of up to 4 sources.
The sipper offers convenient installation and operation, with built-in automatic cleaning, leak detection and protection. It is fully integrated into the new Aqualog 4.0 software for batch analysis and has a variety of uses in water, pharmaceutical, beverage phenolics and many other applications.
When used at a water treatment plant, the sipper and four channel accessory enable the Aqualog to automatically extract and monitor raw, settled and finished water samples. Each sample changer unit is compatible with overflow and filtration devices, serving up to 4 independent water treatment plant sources.
 This product has been discontinued and is no longer available. This page is provided for informational purposes only.