
Honey and maple syrup are valuable natural products whose quality and authenticity are closely connected to their sugar composition. Because lower-cost sugar syrups can resemble authentic products in appearance, taste, and bulk properties, detecting adulteration often requires analytical testing rather than visual inspection alone.
The major sugar profile provides a valuable compositional fingerprint. Authentic honey is dominated by fructose and glucose and generally contains little sucrose, whereas pure maple syrup is predominantly sucrose. Honey composition varies with botanical and geographic origin, season, bee species, maturity, storage, and adulteration. Maple syrup also exhibits natural variation related to maple species, growing location, harvest timing, microbial activity, and processing conditions, although sucrose remains its principal sugar. These profiles influence properties such as sweetness, viscosity, hygroscopicity, and crystallization behavior and can reveal compositional shifts caused by the addition of corn syrup, high-fructose corn syrup, invert syrup, or other sweeteners. Sugar profiling can therefore support product characterization, quality control, and authenticity screening.
Conventional methods for sugar analysis include high-performance liquid chromatography (HPLC), gas chromatography, nuclear magnetic resonance spectroscopy, and infrared spectroscopy. Although these techniques can provide valuable analytical information, routine testing requires specialized instrumentation, trained operators, sample preparation, chromatographic separation, or relatively long analysis times. These requirements can limit the number of samples that can be evaluated efficiently.
Raman spectroscopy offers a complementary approach. It provides chemically specific molecular fingerprints, is compatible with aqueous samples because water produces relatively weak Raman scattering, and can quantify multiple sugar components from a single spectrum. When combined with multivariate analysis methods such as partial least squares (PLS) regression, Raman spectra can be used to distinguish and estimate structurally similar sugars, even when their spectral bands overlap.
By bringing Raman spectroscopy into an automated plate-reader format, the PoliSpectra® Rapid Raman Plate Reader (RPR) enables rapid, standardized screening of multiple honey and syrup samples with minimal sample handling.
Reference solutions containing glucose, fructose, and sucrose were prepared individually and as mixtures across a range of concentrations. Their Raman spectra were used to develop a PLS model for predicting the concentrations of the three sugars.
Honey, commercial syrup, a honey–syrup blend, and maple syrup were diluted to 30% w/w with water and measured using 785 nm Raman excitation. After background subtraction, the spectra were analyzed with the PLS model to estimate the relative contributions of fructose, glucose, and sucrose.
This approach combines the molecular specificity of Raman spectroscopy with multivariate analysis to extract compositional information from complex, overlapping sugar spectra.
Clear spectral differences were observed between the honey and syrup samples, particularly in Raman regions associated with sugar molecular structure. The predicted sugar compositions further revealed distinct profiles:
Both pure honey samples exhibited the expected fructose- and glucose-dominated profiles, with fructose slightly more abundant and sucrose representing approximately 1% of the total predicted sugar content.
In contrast, the commercial syrup, composed of corn syrup and high-fructose corn syrup, contained a substantially higher proportion of glucose and more sucrose. The honey-syrup blend produced both a Raman spectrum and a predicted sugar profile intermediate between those of the honey and syrup samples.
These results demonstrate that Raman spectroscopy can identify compositional changes associated with syrup addition to honey and support the rapid screening of samples that may require confirmatory analysis.
The Raman spectrum of maple syrup closely resembled the reference sucrose spectrum. PLS analysis predicted a sugar composition of approximately:
The strong sucrose contribution was consistent with the expected composition of maple syrup and clearly differentiated it from the fructose- and glucose-dominated profiles of honey.
This result demonstrates the potential of Raman spectroscopy and multivariate analysis to characterize different natural sweeteners according to their dominant sugars. With appropriate calibration and validation datasets, the same workflow could be extended to screen maple syrup for compositional changes associated with the addition of other sugar syrups.
Traditional authenticity testing is often performed one sample at a time. The PoliSpectra® RPR brings Raman analysis into a multiwell-plate format, allowing numerous samples, controls, and calibration standards to be measured in a standardized, automated workflow.
Rather than sending every incoming or production sample directly to a more time-intensive confirmatory method, laboratories can use the RPR to screen samples rapidly, identify unusual sugar profiles, and prioritize the most relevant samples for further investigation.
This creates a scalable analytical workflow:
By combining chemically specific Raman spectra, multivariate analysis, and automated plate-based measurements, the PoliSpectra® RPR offers a rapid approach for comparing the sugar profiles of honey, maple syrup, and potential adulterants. The result is a practical front-end screening workflow that can help laboratories identify compositional anomalies and focus confirmatory testing where it is needed most.
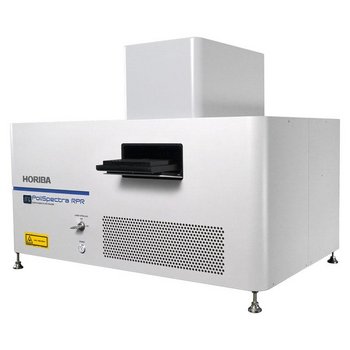
Rapid Raman Plate Reader – Multiwell Fast Raman screening
У вас есть вопросы или пожелания? Используйте эту форму, чтобы связаться с нашими специалистами.

