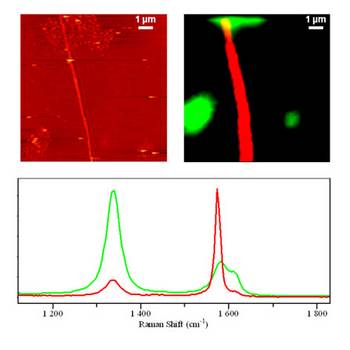

Co-localized AFM topographic (top left) and Raman (top right) images of carbon nanotubes grown on a crystalline silicon substrate. Images were acquired over a 10 µm x 10 µm area, with a step size of 250nm step size for the Raman map.
The spectrum (bottom) shows the carbon D and G band region, illustrating the clear differences between the high quality nanotube (red) and disordered material (green).