High spatial and spectral resolutions
HORIBA’s high throughput 800 mm single stage optimized spectrometer results in the most sensitive instruments on the market, with high throughput diffraction limited spatial resolution. Spectrally, the high resolution spectrometer allows subtle sample information such as crystallinity, polymorphism, strain and other band analysis to be characterized with ease.
From deep UV to NIR without compromise
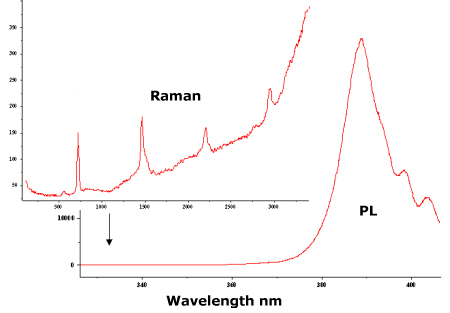
Compatibility with a wide range of laser wavelengths and the possibility of mounting up to three detectors enables the measurement wavelength range to be extended from 200nm to 2200nm. The optimized UV configuration offers the best solution for UV Raman analysis with wavelengths below 400nm. Such performance opens up other spectroscopic techniques such as UV Raman, resonance Raman and photoluminescence, allowing detailed sample characterization from many varied materials.
Ease of use and ergonomy
The fully automated intelligent design of the LabRAM Odyssey ensures ultimate performance coupled with ease of use. The large dedicated application range in the the LabSpec 6 app store makes it possible to configure the software to suit and evolve to your specific needs.
LabRAM Odyssey offers high level of automation like a laser switch, an automated objective turret or an automated spatial calibration with its VRM patented function.
Ultra-fast confocal imaging
The LabRAM Odyssey includes the unique SWIFT™ and DuoScan™ fast Raman imaging technologies.
DuoScan™ is a confocal imaging mode, with high precision, ultra-fast rastering mirrors creating variable sized laser macro-spots, and also allowing macro-step mapping from deep UV to NIR.
SWIFT™ offers confocal Raman mapping with CCD integration times down to 1 ms per point and below.
The unique combination of innovative optics, detectors and software combine to provide true confocal Raman imaging with an unmatched speed of data acquisition.
Raman-AFM and TERS compatible
The integral flexibility of the LabRAM Odyssey means that it is the ideal platform for combined Raman-AFM analysis, and research to TERS (tip enhanced Raman scattering) nano-Raman.
The LabRAM Odyssey can also integrate our patented nanoGPS™ navYX function to achieve a full collaborative characterization with various other microscopy modalities like SEM, FTIR, and others.
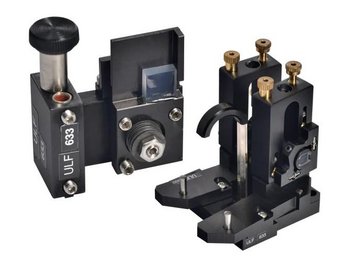
Ultra-Low Frequency Module
The LabRAM Odyssey combines simple access to very low frequencies down to 5cm-1 with a high throughput single stage spectrometer, using the ULF Module. The notch and bandpass filters allows additional sample characterization to be made in a spectral region rarely available with other basic spectrometers.
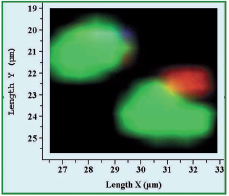
Automated particle location and chemical ID
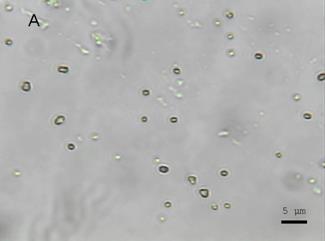
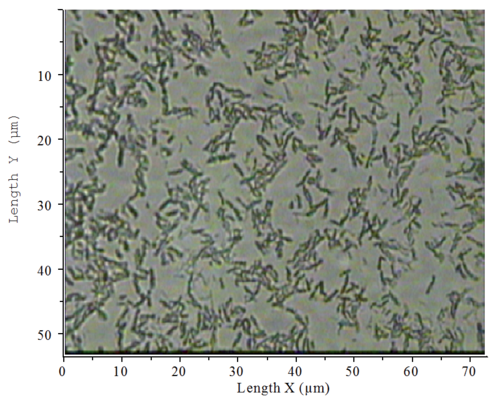
ParticleFinder offers a user friendly tool for automated location, characterization and Raman analysis of particles. Hundreds or thousands of particles can be quickly located and characterized using the LabRAM Odyssey’s advanced Raman capabilities.
Find the best conditions for the analysis of your sample
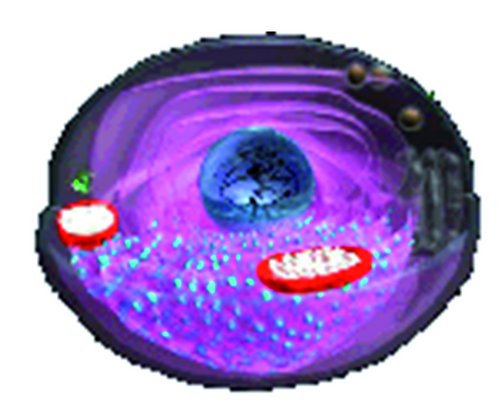
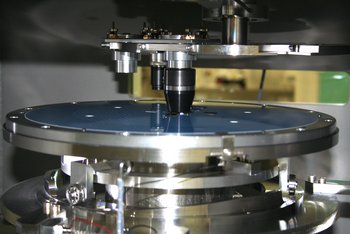
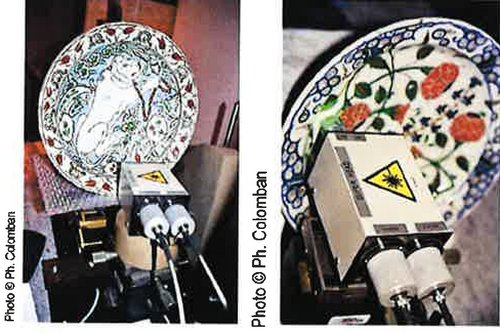
The sampling flexibility of the LabRAM Odyssey ensures that your research can be fully optimized. Standardly equipped with an open-space microscope, giving you free space under the objective to adapt numerous accessories like large cryostats, broad travel range stages… For life science research, the inverted microscope offers ideal sampling for cells and tissues.
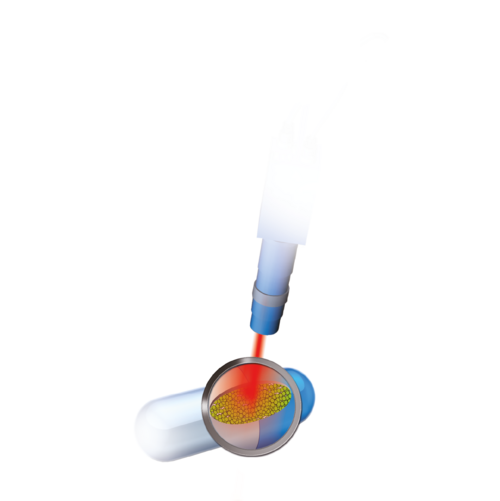
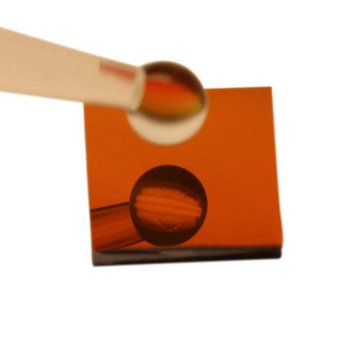
CaptuR laser trapping
A unique and integrated laser trapping solution ideal for fine particle control during microscopic analysis.


.")

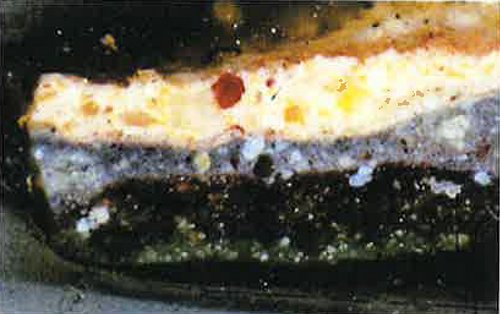
 UFS-RF-GDOES depth profile of the PMSPC; (b) zoom on the first 80 s of the analysis.")


")
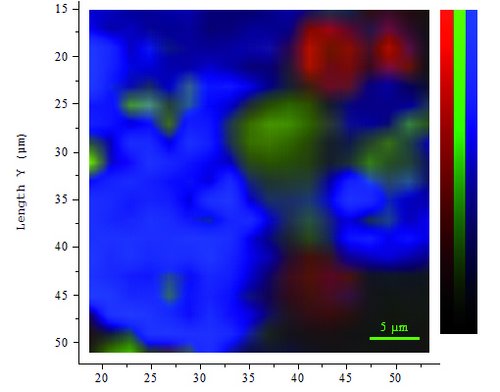
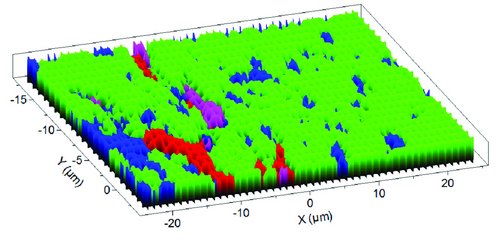
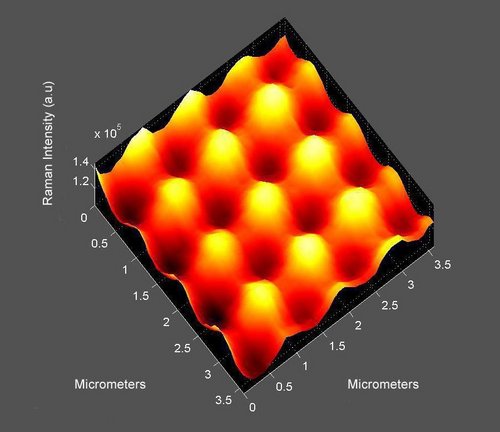
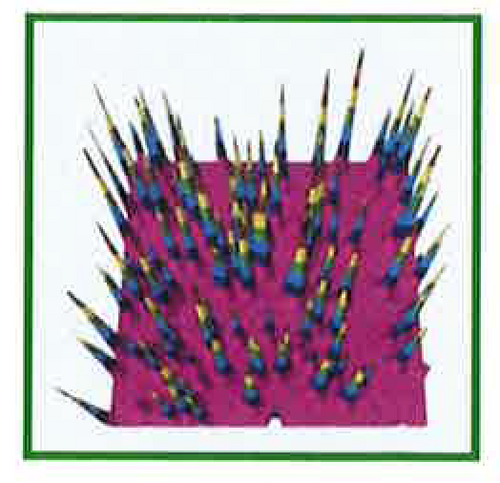
 Raman map of MoS2 layers.")