

Particle properties are rarely defined by size alone. To characterize particles more fully, it is often necessary to evaluate size, shape, count, agglomeration state, and contaminants. Particle Image Analysis is one approach that combines imaging with software-based analysis to measure these properties. Depending on the method, image-based analysis can be performed on static images of prepared samples, on particles in motion, or in in-line/on-line systems for real-time process monitoring. These methods help you understand particle populations and support both R&D and quality control.
1. Particle Image Analysis converts images into particle size and shape distributions. Modern Particle Image Analysis automatically measures particle size and shape from images, and summarizes measurements from large numbers of particles as distributions that describe the sample.
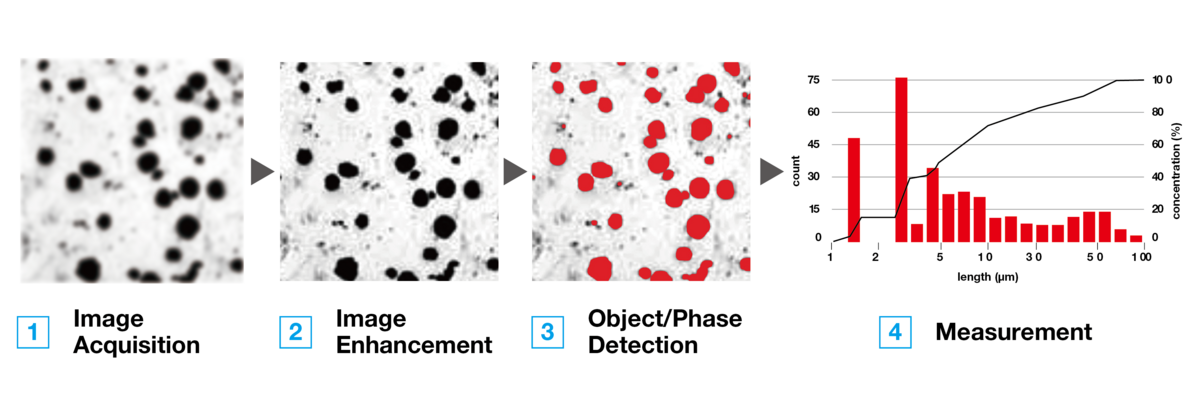
2. The workflow is consistent across methods. Regardless of the imaging method, Particle Image Analysis typically follows four main steps: image acquisition, image enhancement, particle or phase detection, and measurement.
3. The best approach depends on how images are acquired—and whether correlative chemical information is needed. With visible-light imaging, Particle Image Analysis is commonly categorized as Static, Dynamic, or In-Line/On-Line Image Analysis, primarily reflecting differences in image acquisition.
- If you need correlative chemical or elemental identification of the same particle,
Static Image Analysis offers a unique advantage.
- If you need high-throughput statistics, Dynamic Image Analysis is often preferred.
- If you need real-time monitoring, In-Line/On-Line Image Analysis enables
continuous data acquisition.
- Typical Workflow for Particle Image Analysis
- Imaging Methods and Measurable Size Range
- Size / Shape Parameters
- Comparison: Static vs Dynamic vs In-Line/On-Line
- How to Choose (Quick Decision Guide)
Particle Image Analysis extracts physical properties of particles, such as particle size and shape, from images. Because a typical particle sample contains many particles of different sizes and shapes, modern analysis is typically performed automatically with software. Measurements from many particles are then summarized as distributions that describe the sample.
There are four main steps in Particle Image Analysis: image acquisition, image enhancement, object/phase detection, and measurement.
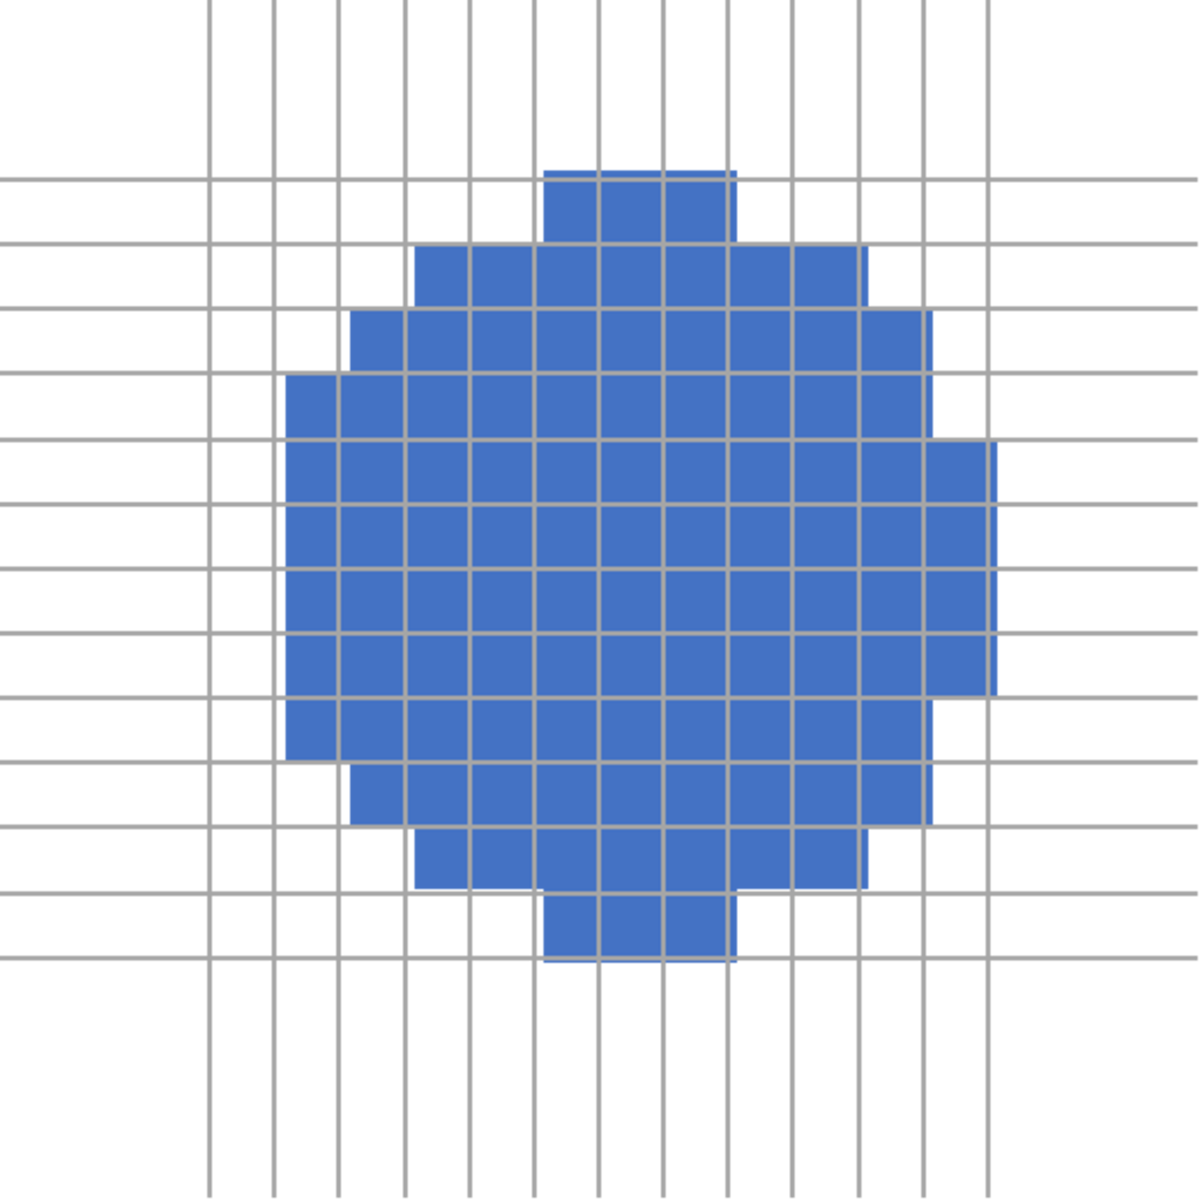
Detected particles are represented as groups of pixels. Therefore, particle-size accuracy is determined by the pixel size, that is, the actual length represented by one pixel. In contrast, the minimum detectable particle diameter depends on both the pixel size and the optical system. For example, if a particle image is captured with an optical system that has a 5 µm resolution and a pixel size of 100 nm, the particle size can be measured with an accuracy of approximately 100 nm, while the minimum detectable particle diameter is approximately 5 µm.
Particle size or shape parameters can be calculated from the image information obtained through particle detection. Common parameters include:
- Equivalent Circle Diameter: The diameter of a circle having the same area as the particle.
- Aspect Ratio: The ratio of the width to the length of the minimum-area rotated rectangle that circumscribes the particle. For a perfect circle, the value is 1.
- Circularity: A parameter calculated so that the value becomes 1 for a perfect circle. It is typically based on the ratio of area to perimeter.
- Feret Diameter (Feret max, also called caliper diameter): The maximum distance between two parallel lines touching the particle outline.
The particle size distribution determined by general image analysis methods is typically presented as a histogram, with particle size or another per-particle parameter on the horizontal axis, and the number of particles on the vertical axis.
Within optical microscopy, Particle Image Analysis can be divided into Static Image Analysis, Dynamic Image Analysis, and In-Line/On-Line Image Analysis. These methods differ mainly in how the sample is presented during image acquisition, which in turn affects throughput, particle tracking, and the type of analysis that can be performed.
- Static Image Analysis: Particles are measured from a stationary sample, typically on a prepared slide. This approach is useful when detailed analysis of individual particles is needed, and it can also support correlative analysis with other techniques.
- Dynamic Image Analysis: Particles are measured as they pass through the field of view. This approach is often preferred when high-throughput statistics are required.
- In-Line/On-Line Image analysis: Measurements are performed directly in the process, either through a window or via a bypass line. This approach is well-suited for real-time monitoring and continuous data acquisition.
Please refer to the respective pages for more details.
1. Key Characteristics of Each Method
Comparison Item | Static Image Analysis | Dynamic Image Analysis | In-Line/On-Line Image Analysis |
|---|---|---|---|
| Sample State | Stationary Dispersed and fixed | Flowing In air or liquid | Flowing |
| Measurement Speed/Throughput | Slow Analyzes particles within a limited field of view; takes time to achieve statistical reliability. | Fast Can measure tens of thousands, to millions of particles in a short time. | Fast/Continuous Enables real-time, continuous data acquisition. |
| Sample Preparation | Time-consuming Particles must be uniformly dispersed on a surface without overlapping. Results are highly dependent on operator skill. | Relatively Easy Utilizes dry (air) or wet (solvent) dispersion units. The system automates flow and dispersion, minimizing the need for operator skill. | Minimal to None Direct in-line measurement requires no preparation. Alternatively, an automated bypass system (on-line setup) can be installed to extract and dilute the sample to optimal conditions. |
| Image Quality/Resolution | Very High Allows for precise focusing, making it ideal for evaluating minute surface structures and exact shapes. | High to Medium Requires short exposure times to prevent motion blur. Image quality may be slightly lower than static analysis. | Environment-dependent Susceptible to process conditions. Using a bypass line with automated dilution can improve image clarity. |
| Integration with Chemical/Elemental Analysis | Easy Enables multi-modal analysis of the same particles using hybrid systems or cross-platform tracking. | Difficult Technologically challenging to acquire chemical signals for individual, fast-moving particles. | Difficult Technologically challenging to acquire chemical signals for individual, fast-moving particles. |
2. Key Advantages and Typical Applications
Comparison Item | Static Image Analysis | Dynamic Image Analysis | In-Line/On-Line Image Analysis |
|---|---|---|---|
| Key Advantages |
|
|
|
| Main Applications |
|
|
|
Use Static Image Analysis if you need the highest image quality and detailed shape evaluation. Because particles are stationary, you can precisely focus and capture extremely high-resolution shape data, making it well-suited for R&D, foreign particle investigations, and detailed defect analysis, such as correlative chemical/elemental identification on the same particle. Stationary particles on a slide or filter can be targeted with probes such as lasers or X-rays for molecular structure and elemental analysis on the exact same particles.
Choose Dynamic Image Analysis when you need fast, statistically reliable results. Particles flow through the field of view, enabling measurement of tens of thousands, to millions, of particles in a short time—ideal for routine inspection and quality control where throughput matters.
Select In-Line/On-Line Analysis for real-time, continuous process monitoring. When you want continuous data acquisition directly from the process (or via an automated bypass line), In-line/On-line setups minimize sampling effort and support feedback for automated control of manufacturing lines.
The required number of particles depends on the width of the particle size distribution and the desired confidence level. For powders with a uniform, narrow particle size distribution, a small amount of data is sufficient. However, to obtain reliable data for materials with a wide distribution, information on a large number of particles is necessary. Specific numerical values are provided in ISO 13322. As a rule of thumb, Dynamic Image Analysis can reach statistical reliability quickly because it can measure tens of thousands to millions of particles in a short time, while Static Image Analysis may take longer due to a limited field of view.
Static Image Analysis is best when you need very high-resolution shape data and may want to combine morphology with chemical/elemental analysis on the same stationary particles. Dynamic Image Analysis is best for fast, high-statistics measurements, and In-line/On-line Analysis is best for real-time, continuous monitoring in a process.
Preparation depends on the method: Static Image Analysis is typically time-consuming because particles must be uniformly dispersed without overlapping, while Dynamic Image Analysis often uses dry/wet dispersion units with automated flow/dispersion. In-line/On-line Analysis can require minimal preparation for direct in-line measurement, or use an automated bypass line to condition the sample.
Particle shape parameters (such as aspect ratio, circularity, and sphericity) significantly affect the physical properties and performance of materials. For example, even if powders have the same particle size, those with a higher degree of circularity have the characteristic of having higher fluidity as a powder. Image analysis enables accurate measurement of these parameters, supporting quality control and process optimization.
Common parameters include equivalent circle diameter, maximum Feret diameter, aspect ratio, and circularity. These are used for physical characterization and process control.Common parameters include equivalent circle diameter, maximum Feret diameter, aspect ratio, and circularity. These are used for physical characterization and process control.
Image analysis measures individual particle size and shape directly, while laser diffraction estimates particle size distribution based on light scattering. Each method has advantages depending on the application. When comparing, it is important to pay attention to the particle size basis (whether it is based on number or volume).
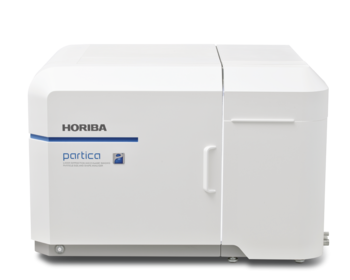
Laser Diffraction and Dynamic Imaging Particle Size and Shape Analyzer
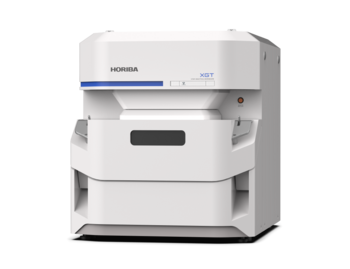
X-ray Analytical Microscope (Micro-XRF)
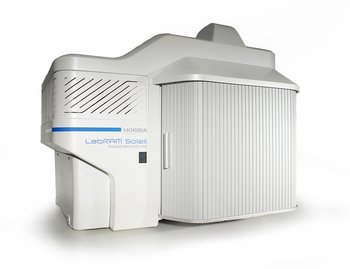
Raman Spectroscope - Automated Imaging Microscope
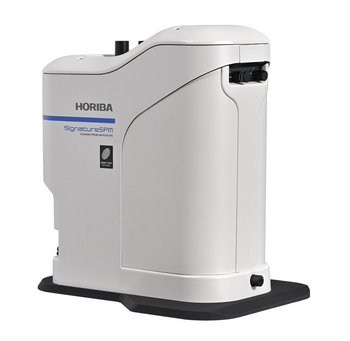
Scanning Probe Microscope with Chemical Signature
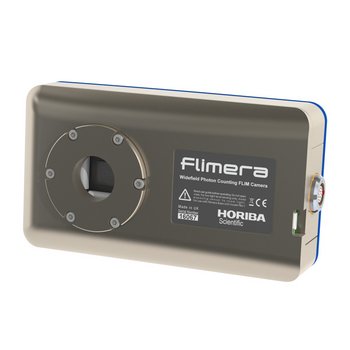
SPAD array imaging camera for dynamic FLIM studies at real time video rates
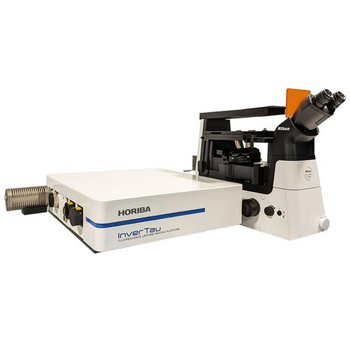
Fluorescence Lifetime Imaging Platform
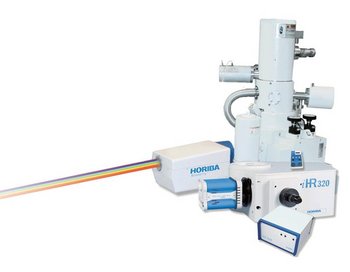
Cathodoluminescence Solutions for Electron Microscopy
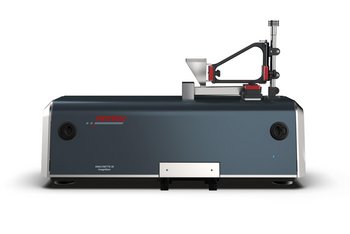
Dynamic Image Analysis
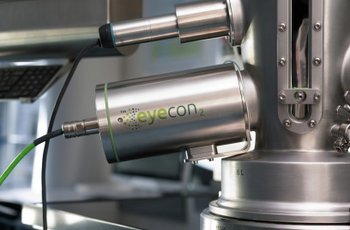
Direct Imaging Particle Analyzer
Tiene alguna pregunta o solicitud? Utilice este formulario para ponerse en contacto con nuestros especialistas.