LabRAM HR Evolution

LabRAM HR Evolution

顕微レーザーラマン分光測定装置 

顕微レーザーラマン LabRAM HRシリーズの最高峰、オートメーション機能を強化

多くの科学研究者の皆様にはLabRAM HRシリーズを1993年の発売以来、23,000件を超える学術報告にLabRAM HRシリーズのデータが掲載されています。LabRAM HR Evolutionは、紫外~近赤外領域における高いスペクトル分解能を継承するとともに、サブミクロンスケールの空間分解能、オートメーション機能を強化したHORIBA最高峰の顕微ラマン分光装置です。


事業セグメント: 科学
製造会社: HORIBA France SAS
  • 紫外から近赤外まで 広い測定波長域 220nm~2200nm
  • 焦点距離 800mm:高いスペクトル分解能を実現する高性能大型分光器採用
  • 自動光軸調整機構
  • 光学系の自動切替機構搭載:レーザー、フィルタ等をソフトウェアからコントロール
  • 0.5μ m以下の高空間分解能
  • 超高速イメージング SWIFT
  • 超低波数測定モジュール ULF:10cm-1以下領域までのラマン測定可能
  • 自由度の高いプラットホーム
    豊富なアクセサリの装備が可能、他システムとの複合機を実現。
    AFMラマン、フォトルミネッセンス、透過ラマン、加熱冷却ステージ、クライオスタット
    光学顕微鏡用各種アクセサリ、など
  • 粒子解析ソフトウェアParticleFinderを搭載可能


高波数分解能の効果

LabRAM HR Evolutionは高い波数分解能を持ち、より近接したピークの判別や、応力や構造変化、温度変化によるわずかなピーク位置のシフトの検出能力に優れています。

<分光器の焦点距離による、ピーク形状の違い>

焦点距離の長い分光器を使用すれば、近接するピークをはっきりと見分けることができます。また、わずかなピークシフトの測定も可能です。特に半導体や医薬品の分野において、高波数分解能の測定が求められるケースが多くあります。

▶関連アプリケーションはこちら

 LabRAM HR UV-VIS-NIRLabRAM HR VIS-NIR
波長範囲220~2200nm440~2200nm
低波数カットオフ *150 cm-1 / 5 cm-1 (ULF Option)
スペクトル分解能*20.2 cm-1 以下
グレーティング2枚標準搭載(刻線数・ブレーズ波長は別途ご相談ください。)
分光器焦点距離800mm
空間分解能水平分解能 (XY) 0.5μm 以下、Z方向分解能 1.5μm 以下(488nm 励起の場合)
レーザー搭載可能レーザー : 244nm、266nm、325nm、355nm、405nm、442nm、457nm、473nm、488nm、514nm、532nm、633nm、785nm、830nm、1064nm など
クラス3B システム(オプションCDRH レーザー安全クラス1 対応)
ファイバーポート(オプション)
レーザー自動切り替え機構(最大4 波長)
光学顕微鏡Olympus BX シリーズ(観察用カメラ搭載)
(オプション) 暗視野観察、偏光観察、微分干渉観察、蛍光観察
5倍、10倍、100倍対物レンズ 標準搭載(長作動レンズほか倍率はお問い合わせください)
減光フィルタ9段階(100%、50%、25%、10%、5%、3%、1%、0.1%、0.01%)
検出器(標準搭載)空冷ペルチェCCD 1024 x 256 ピクセル
(オプション)液体窒素冷却CCD
最大3 検出器まで搭載可能
外形寸法1300mm x 1200mm x 473mm [WxDxH]  ※レーザー3波長の場合
質量約150kg  ※検出器、レーザー除く
電源(本体)単層AC100 ~ 240V ± 10%

(*1) 基本的な目安値(レーザー波長 488 nm、514 nm、532 nm、633 nm、785 nm)
(*2) FWHM 値(スリット幅 25 μ m、 633 nm 励起、2400 gr/mm グレーティング)


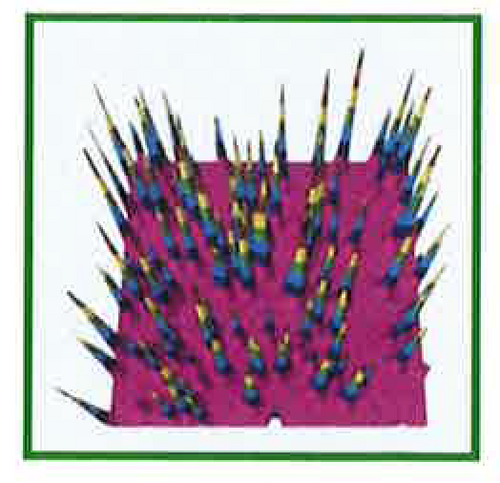
Three Dimensional Raman Imaging
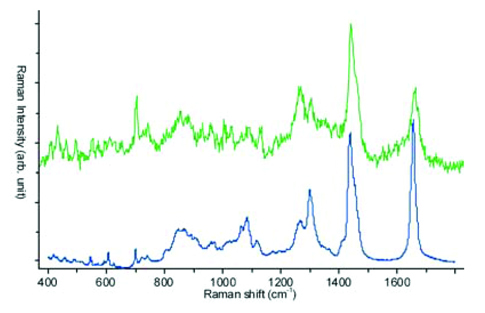
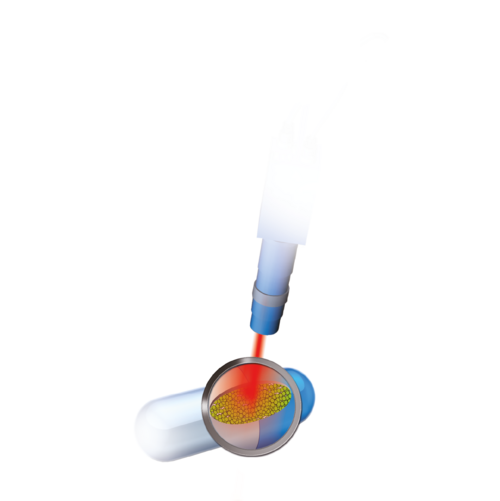
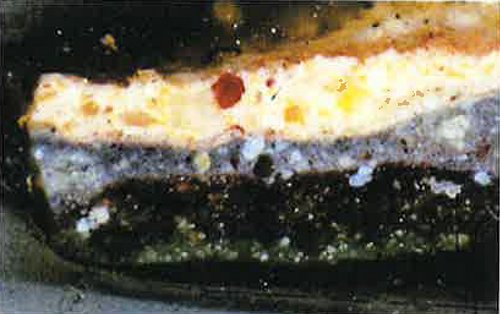
Segmented channel waveguides have been fabricated in single crystal KTiOPO4 through a topotactic process of partial cation exchange. The ion-exchanged waveguides maintain the high nonlinear susceptibility of KTiOPO4 to function as frequency doubling laser light sources. We apply three dimensional (3D) Raman imaging to understand and characterize the changes to the chemical bonding and crystalline structure as well as measure the volumetric structure of the waveguide segments.
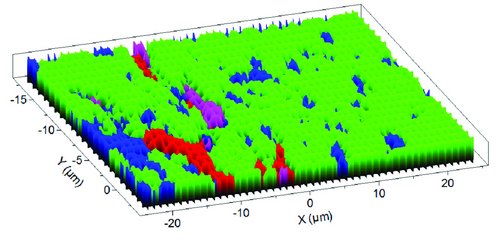
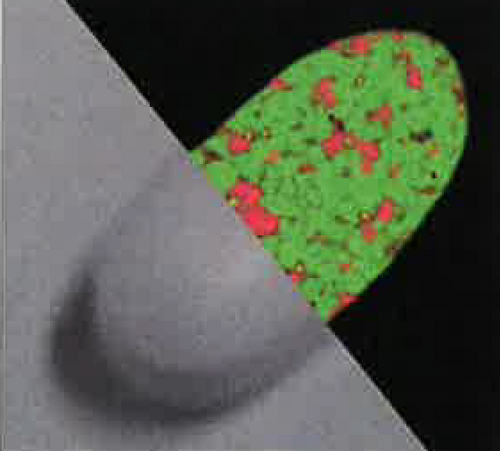
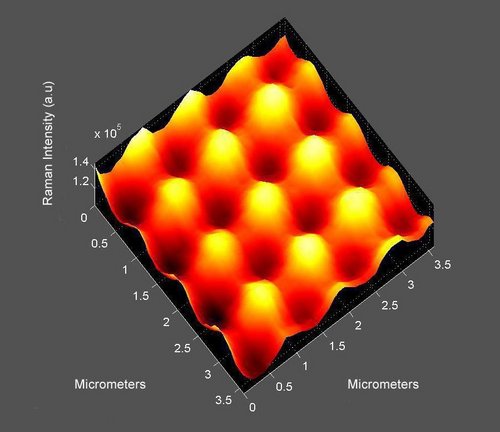
Raman Microscopy Applied to Polymer Characterization: An Overview
Raman microscopy is an excellent tool to address the polymer research. Raman microscopy can be used to characterize raw materials, to inline or outline monitor polymerization process, to investigate orientation and crystallization changes, and also to control the quality and traceability of genuine products, by understanding defects and compounds distribution. In this article we present how HORIBA Raman microscopy solutions can support the polymer chemical and structural understanding.
Raman Spectroscopy Applied to the Lithium-ion Battery Analysis
The application note explains how the Raman Spectroscopy can be helpful in the analysis of cathodes and anodes in Li-ion batteries. Today’s state of art of technology requires more reliable, more efficient and powerful energy sources. Lithium-ion batteries are thus of high interest. Raman spectroscopy adapts to the different stages of life of these batteries, such as the characterization of new materials for more flexible systems, failure analysis; but also more standard analysis of used material during charge/discharge process, including structural and electronic properties, and even robust, automated QC tests.
Insights into thrombosis mechanisms using high resolution SERS
Raman Analysis of Single Bacteria Cells
Traditionally, Raman has been a technique of the material scientist, physicist or chemist, but as instrumentation continues to evolve, the power of Raman in biological and medical applications is fast being realized, not least because of the high information content provided and an excellent tolerance for water.
Raman Investigation of Micro-organisms on a single cell level
Raman Imaging of monkey brain tissue
Fast and non-invasive methods for clinical and non clinical investigations for biological tissue are more and more required. Raman imaging at micro scale can answer to crucial questions about the monkey brain tissue morphology and structural evolution.
Raman Analysis of Sperm Nuclear DNA Integrity
Raman Spectroscopy was evaluated as a non-invasive method of analysis of sperm DNA and the influence of UV irradiation on the sperm. The results show that Raman Spectroscopy, combined with multivariate analysis provide the reproducible and accurate information on DNA of sperm and the effect and location of damage.
Raman Microscopy in Pharmaceutical Salt Analysis
Pharmaceutical and crystallographic samples typically require detailed characterization and analysis to optimize a samples stability, physical properties and indeed general efficacy where an active drug substance is involved.
Investigating the atherosclerosis process by monitoring lipid deposits including cholesterol and free fatty acids
In Vivo Raman measurements of Human Skin
Confocal Raman spectroscopy is beginning to be recognized as a high potential technique for the non invasive study of biological tissues and human skin under in vivo conditions. Raman spectroscopy can be applied to obtain information regarding the molecular composition of the skin down to several hundred micrometers below the skin surface.
Graphene Studies using Raman Spectroscopy
Graphene is a new nanomaterial which may partially replace silicon in microcircuits and computer chips in the future. In order to better understand its quality characteristics, fast reliable techniques that deliver the right property measures are needed. Raman spectroscopy has emerged as a key technique for studying this exceptional material.
SWNT Quality Control by Raman Spectroscopy
Raman has shown a high potential in characterising the SWCNTs' structure. The correlation between knowledge about structure with physical and chemical properties about the tubes make the technique extremely powerful to control the quality of the SWCNTs for specific applications. Raman spectrometer capabilities like spatial resolution, spectral resolution and excitation wavelength versatility have been examined. Beside Raman, preliminary fluorescence studies are describing the potential of the technique.
Coloured Diamond Defect Identification by Raman Diffusion and Photoluminescence
The colour enhancement treatment on native brown and yellow diamonds can be highlighted by Photoluminescence analyses performed with the Raman spectrometer LabRAM HR. The PL signature of green and violet diamonds has also been recorded. The defect centres responsible of the colour of the diamonds have all been detected and assigned. This proves the Raman spectrometer to be a very good tool to investigate the fine defects in the Diamond structure by Photoluminescence analysis.
Derivation of Physical Parameters from Raman Spectra of Hard Carbon Films
The Raman spectra of elemental carbon materials are known to be sensitive to polymorphy. For hard carbon films, the spectra of amorphous and diamond-like carbons can be band-fit to separate the contributions of the "graphitic carbon" (G band) from the "disordered carbon" (D band). The spectral behaviour of carbon films has been empirically correlated with thin film physical properties such as hardness, durability, optical transparency, electrical conductivity, thermal conductivity and corrosion resistance, and can be of use for prediction of these properties without extensive alternative testing. The DiskRam has been designed to automate the collection of Raman spectra from hard carbon coatings on computer hard disk media and the extraction of parameters that are well correlated with the properties of the films. The extracted information is output in spreadsheet format for SPC at a manufacturing facility.
Impact of Raman Spectroscopy on Technologically Important Forms of Elemental Carbon
The Raman spectra of the various forms of elemental carbon are very sensitive to the type of nearest neighbour bonding, and to intermediate and long range order. In many cases Raman spectroscopy is the technique of choice for characterization of carbon materials. Correlation of Raman spectral features with tribological properties can facilitate the deposition of carbon films.
Number of Layers of MoS2 Determined Using Raman Spectroscopy
The two methods - Analysis of fingerprint modes (intralayer) and Analysis of low-frequency modes (interlayer) - give complementary results and allow the determination of the number of MoS2 layers. Method 2 (using low frequency modes) gives excellent contrast; however it does not show single layer regions (which is related to the nature of the modes, rising from interaction between at least two layers). Method 1 (using fingerprint modes) shows all the layers, but the contrast is poorer, particularly for higher numbers of layers. The best result can be obtained combining the two methods. All the measurements (low-frequency and fingerprint) were done using ultra-low frequency ULFTM filters which allow a high throughput measurement in a full Raman range, down to <10 cm-1.
Characterization of MoS2 Flakes using TEOS
Both TEPL and TERS images are well correlated with AFM morphological images obtained simultaneously, and all are consistent in revealing the nature (number of layers) of MoS2 flakes. Upon deconvolution, the TEPL signal is even capable of revealing local inhomogeneities within a MoS2 flake of 100 nm size. Kelvin probe measurement supports TEPL and TERS measurements and adds to the power of such tip-enhanced combinative tools. TEOS characterization of 2D materials is likely to contribute to further deployment of these materials into commercial products through a better understanding of their electrical and chemical properties at the nanoscale.
Combined Raman and Photoluminescence Imaging of 2D WS2
Raman and photoluminescence spectroscopy reveal different aspects of the solid state structure of 2D materials. Raman and photoluminescence imaging performed simultaneously with one instrument reveals the spatial variation of the solid state structure and electronic properties of 2D crystals that is not revealed in reflected white light imaging. That ability should allow materials scientists to better design and fabricate electronic and optoelectronic devices based upon 2D crystals.
Microscopic Measurement of Diffusion
In order to engineer materials with controlled diffusive properties, we need to be able to measure the diffusive process in situ. Ideally, we would like a technique that provides molecular information with resolution on a microscopic scale, that is non destructive of the samples, and can be set up and used on a laboratory bench top with a minimum of time and effort involved in sample preparation. Raman microprobe spectroscopy is an ideal candidate for this type of studies. Use of visible light combined with a confocal microscope provides a probe with spatial resolution of a micron or better, and coupling of such a microscope to a modern Raman spectrometer equipped with holographic notch filters and CCD multi channel detectors allows rapid acquisition of Raman spectra which can be correlated with the chemical state of the species and its physical environment.
Observing Oxidating Kinetics on an aluminium alloy surface with Fluorescence mapping
Strain Measurements of a Si Cap Layer Deposited on a SiGe Substrate, Determination of Ge Content
Raman spectroscopy is a very well suited technique to determine both Ge fraction and strain in SiGe layers and Si cap layers. Moreover the possibility of using both UV and visible excitation lines on the same instrument is essential to study structures made up of a Silicon cap layer on top of a SiGe layer. The relative Ge content in the constant Si1-xGex layer is calculated from the visible Raman spectrum and the strain of the cap Si layer is derived from the UV Raman spectrum.
Concentration Profile Measurements in Polymeric Coatings During Drying by Means of Inverse-Micro-Raman-Spectroscopy
The coupling of the power of confocal Raman microscopy to the inverted sampling geometry has enabled detailed investigations to be made of solvent and water based coating systems, providing important information on the processes and chemistry that occurs at the coating interface and within.
Localisation of Polymeric Phases by Raman Microscopy Mapping Components of a Blend in a Plane and Depth Profiles of Laminated Film
Blending, an alternative method for engineering products that combines the properties of polymer types is a physical mixing. It has the advantage of being not only simple and inexpensive, but also allows for re-cycling used material. Incompatibility or non-miscibility of the differing chemical components is often an issue in the final performance of the polymer product. The first part of this note concerns the dispersion of the two components in a polyethylene-polybutylene terephthalate blend. The chemical imaging capabilities of the LabRAM are used to get this information. The second part deals with the depth analysis of laminated films made of different polymer layers.
Transmission Raman Spectroscopy: Review of Applications
The transmission design has demonstrated to be the technique of choice whenever Raman spectral information of a bulk material is required. It has already proven its utility for pharmaceutical applications, as tablets or even powder mixtures are good candidates for this measurement mode. However, transmission Raman might be applied successfully to other sample types, such as polymers, bio-tissues or any translucent material, and can be envisaged for evaluating the content of product inside a package. In addition, as TRS provides a global spectral information of the measured sample, it will be a technique of choice when quantitative evaluation of mixtures is needed.
Raman Characterization of Polymers in Industrial Applications
Recent developments in Raman instrumentation have made the technique easier to use, more compact, and more affordable. Consequently, all of the demonstrated potential of the spectroscopy for industrial uses can now be exploited, including its use in combination with statistical methods for concentration calibrations.
Real-time Monitoring of Polymerisations in Emulsions by Raman Spectroscopy - Modelling and Chemometrics
Raman spectra, in conjunction with Multivariate (Chemometric) Analysis, have been demonstrated to provide real-time information on the progress of a polymerisation reaction. As shown by this example, these results can provide unexpected information on the details of the reaction. in this case, the inequivalent reaction rates of the two monomers. Such information ultimately enables the process engineer to optimise his process.
Using Chemometrics and Raman Spectra for Quantitative Predictions of Physical and Chemical Properties of Polymers
As far as polymeric fibres are concerned, slight modifications of Raman features are directly related to differences in the molecular orientation and the degree of crystallinity of the fibres. To utilize these subtle spectral changes and correlate them with physical properties of the polymer, one is obliged to use Chemometrics on the Raman spectra. The resulting synergism between Raman spectroscopy and Chemometrics will provide a powerful tool for monitoring and control of manufacturing of polymeric materials.
Raman Imaging of Holographic Gratings Inscribed on Polymer Thin Films
Using holographic techniques we have structured the surface in a one step procedure (no wet nor photocuring processing ) along the X and Y directions. A grating is first inscribed with grooves along the X direction, the sample is rotated by 90° and a second grating is inscribed with grooves along the Y direction. The intensity of the 1st diffracted orders is monitored to have equal intensities in both X and Y directions.
Raman Mapping of Wheat Grain Kernels
Raman analysis of a 50 μm section of a wheat grain kernel has allowed spectral features corresponding to starch, lipid and proteins to be identified. The distribution of these components on the micron scale has been studied using a Raman mapped image. Decomposition of the Amide I band allows a correlation between protein structures and grain hardness.
Valuable analysis tool for cosmetics and skin characterization
Confocal Raman Spectroscopy is an important analytical tool in various fields and it has shown high efficiency for specific applications in the cosmetic and/or pharmaceutical fields. Its non-invasive behavior, and its high molecular sensitivity make it one of the preferred label-free analytical techniques to characterize materials such as skin and cosmetic products.
Milk compounds characterization by optical spectroscopies and laser diffraction
In the food industry, the compounds characterization is a critical step to ensure the quality of the products or to provide information to customers which can be sensitive to allergies. In this application note, we showed how optical spectroscopies and laser diffraction can help for food compounds characterization, especially on a specific product, i.e. milks.
Morphological and chemical characterizations of microplastic particles using ParticleFinderTM and Raman techniques
The assessment of microplastics in a marine environment is a multi-step process (sampling, extraction, detection and quantification of microplastics), in which each step is time consuming. Analyzing the chemical composition and morphology of microplastics represents a real challenge for answering crucial questions about the sources and fate of microplastics in aquatic environments. In this application note, we present a reproducible and time-effective method for fast and thorough morphological and chemical characterization of microplastics using a semi-automated scanning of particles coupled to micro-Raman spectroscopy. The rapid analysis of large number of collected particles allows for an exhaustive assessment of both large sample sizes and small subsamples.

お問い合わせ

* 項目は必ずご記入ください。

HORIBAグループ企業情報